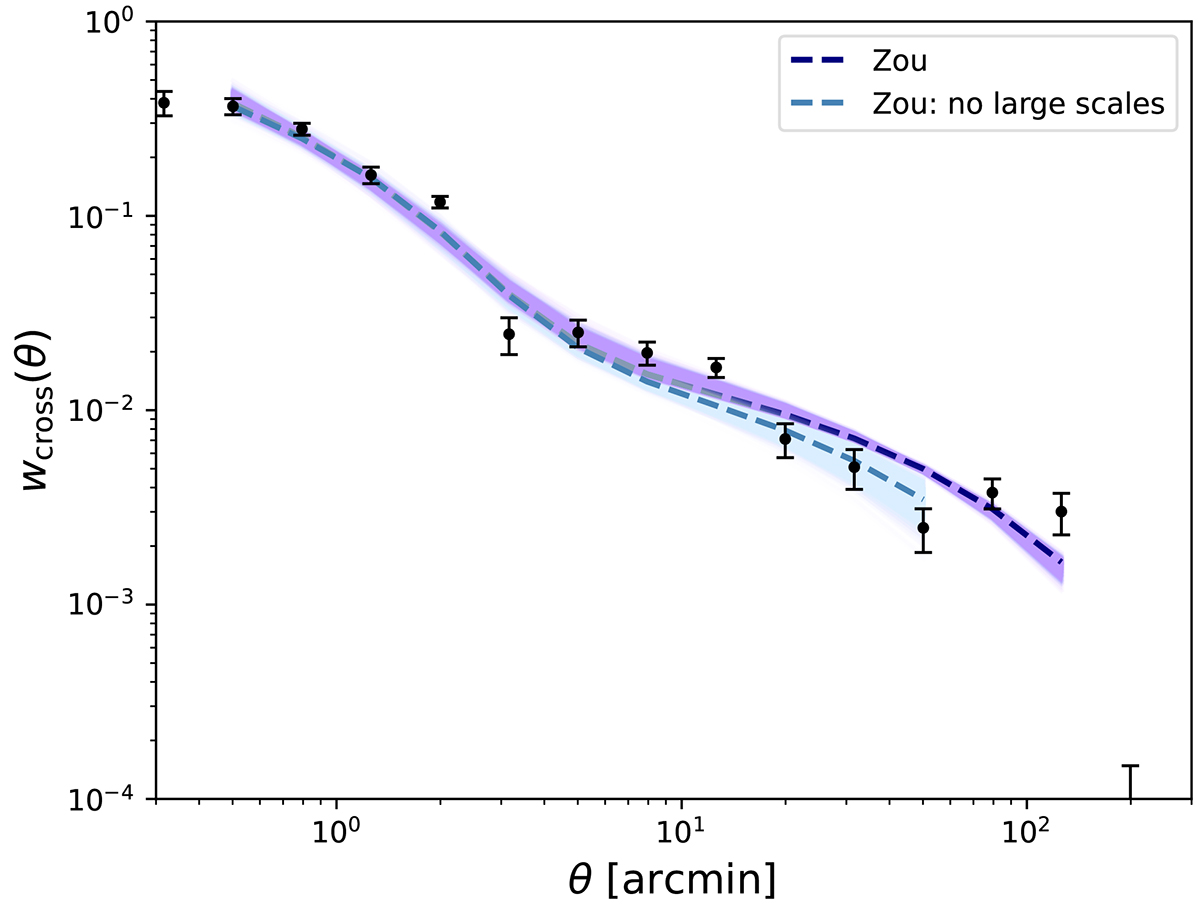
Fig. 5.
Download original image
Sampling plots for ZOU. The dark blue and light blue regions illustrate the posterior sampling of the cross-correlation function derived from the entire dataset and the omitted large-scale cases (in which data exceeding ≳60 arcmin were excluded), respectively. Dashed lines indicate the best fit, and the data points are represented by black dots.
Current usage metrics show cumulative count of Article Views (full-text article views including HTML views, PDF and ePub downloads, according to the available data) and Abstracts Views on Vision4Press platform.
Data correspond to usage on the plateform after 2015. The current usage metrics is available 48-96 hours after online publication and is updated daily on week days.
Initial download of the metrics may take a while.