Open Access
Fig. C.1.
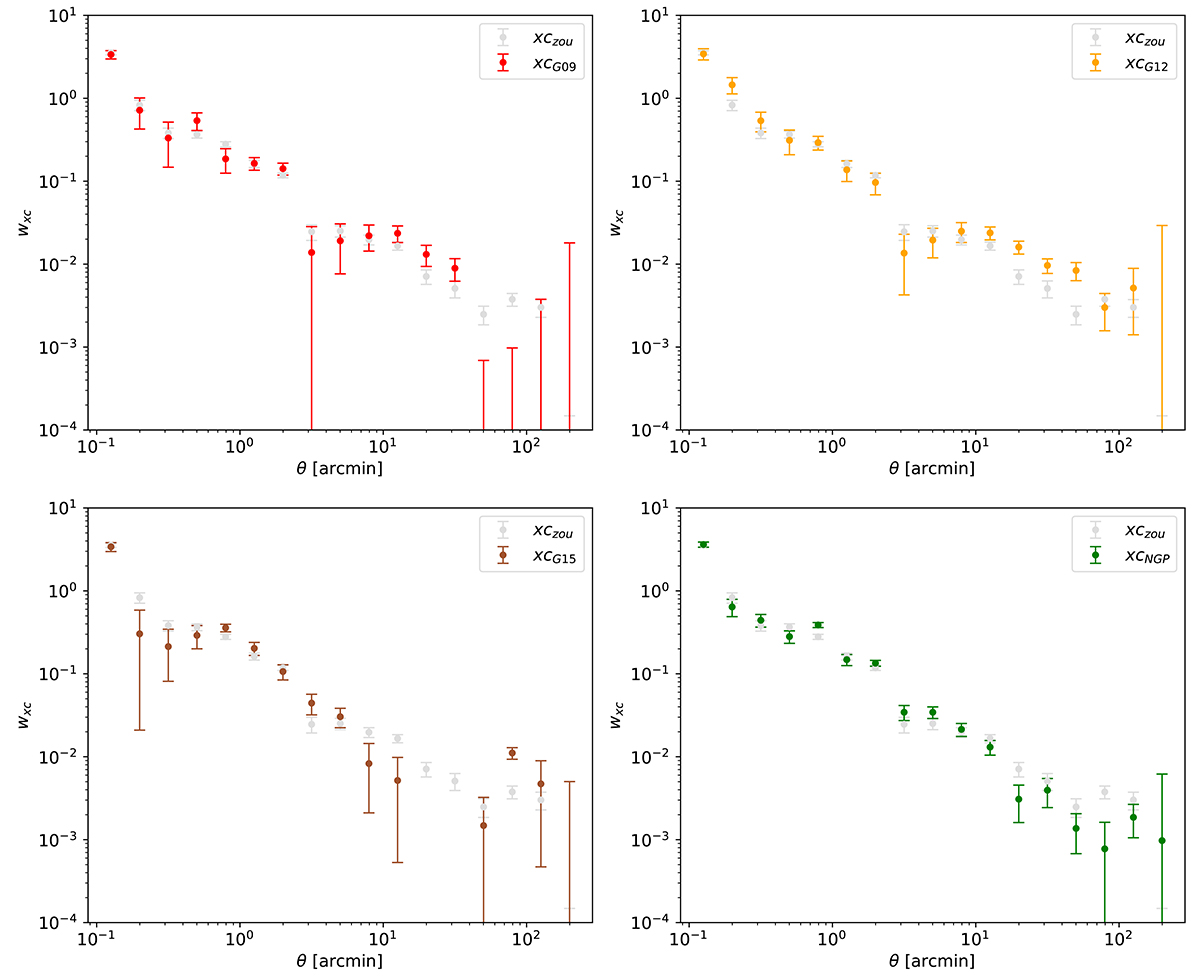
Download original image
Cross-correlation data acquired for the ZOU sample was analysed across different zones. The panels depict G09 in red, G12 in yellow, G15 in brown, and NGP in green. The light grey data appearing in each panel correspond to the cross-correlation obtained using all four zones.
Current usage metrics show cumulative count of Article Views (full-text article views including HTML views, PDF and ePub downloads, according to the available data) and Abstracts Views on Vision4Press platform.
Data correspond to usage on the plateform after 2015. The current usage metrics is available 48-96 hours after online publication and is updated daily on week days.
Initial download of the metrics may take a while.