Fig. B.2.
Download original image
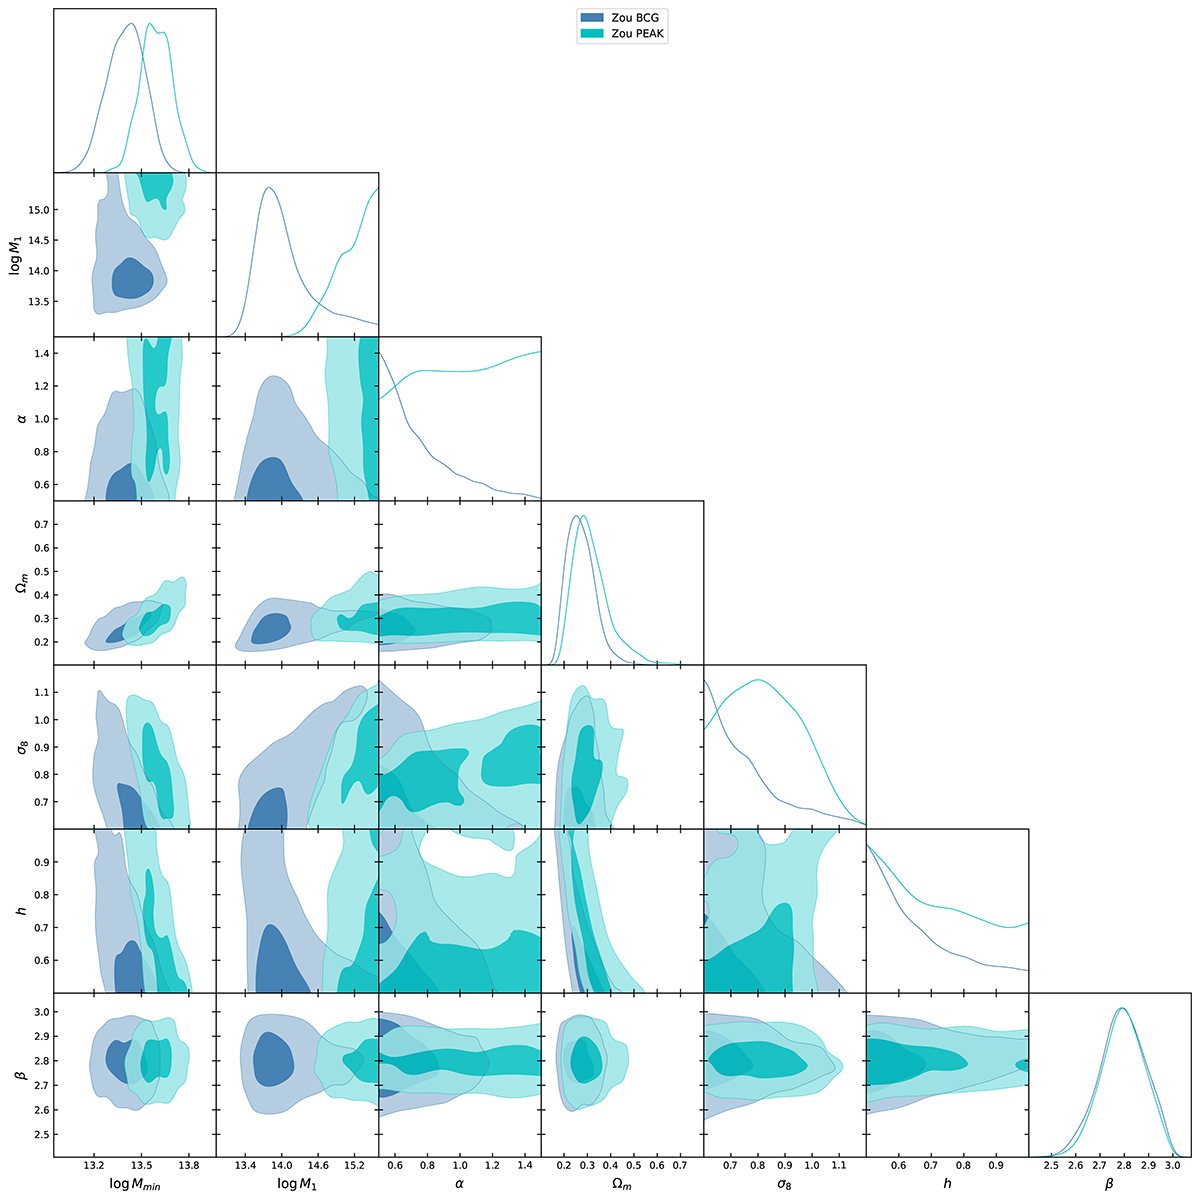
Marginalised posterior distributions and probability contours for the MCMC runs on the cross-correlation function using the two different available positions for ZOU cluster data. The dark blue fit was obtained using BCG positions, and the light blue fit was obtained using PEAK positions. In both cases, cross-correlation data above ≳60 arcmin were discarded.
Current usage metrics show cumulative count of Article Views (full-text article views including HTML views, PDF and ePub downloads, according to the available data) and Abstracts Views on Vision4Press platform.
Data correspond to usage on the plateform after 2015. The current usage metrics is available 48-96 hours after online publication and is updated daily on week days.
Initial download of the metrics may take a while.