Fig. 12.
Download original image
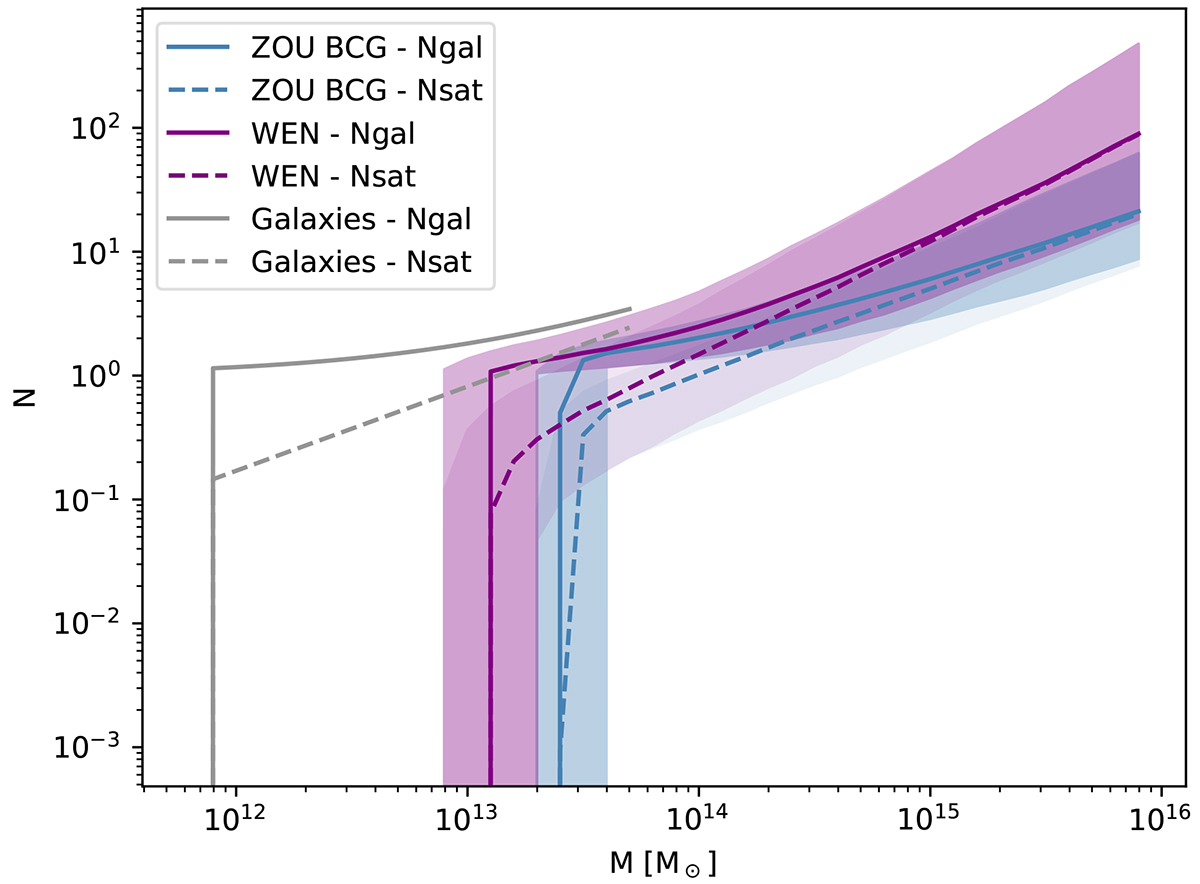
Mapping the total number of galaxies (Ncen + Nsat, solid line) or the number of satellites (Nsat, dashed line) to halo mass (M) using the HOD model across various lenses in this study. Samplings for the clusters are depicted in blue (ZOU) and purple (WEN); the solid and dashed lines represent the sampling median for the number of galaxies and satellites, respectively, and the shaded regions indicate the 68% confidence interval. Large-scale data were excluded for both datasets. Additionally, results obtained by applying the HOD model to mean data from the galaxy sample in Cueli et al. (2024) are shown in grey.
Current usage metrics show cumulative count of Article Views (full-text article views including HTML views, PDF and ePub downloads, according to the available data) and Abstracts Views on Vision4Press platform.
Data correspond to usage on the plateform after 2015. The current usage metrics is available 48-96 hours after online publication and is updated daily on week days.
Initial download of the metrics may take a while.