Fig. 8.
Download original image
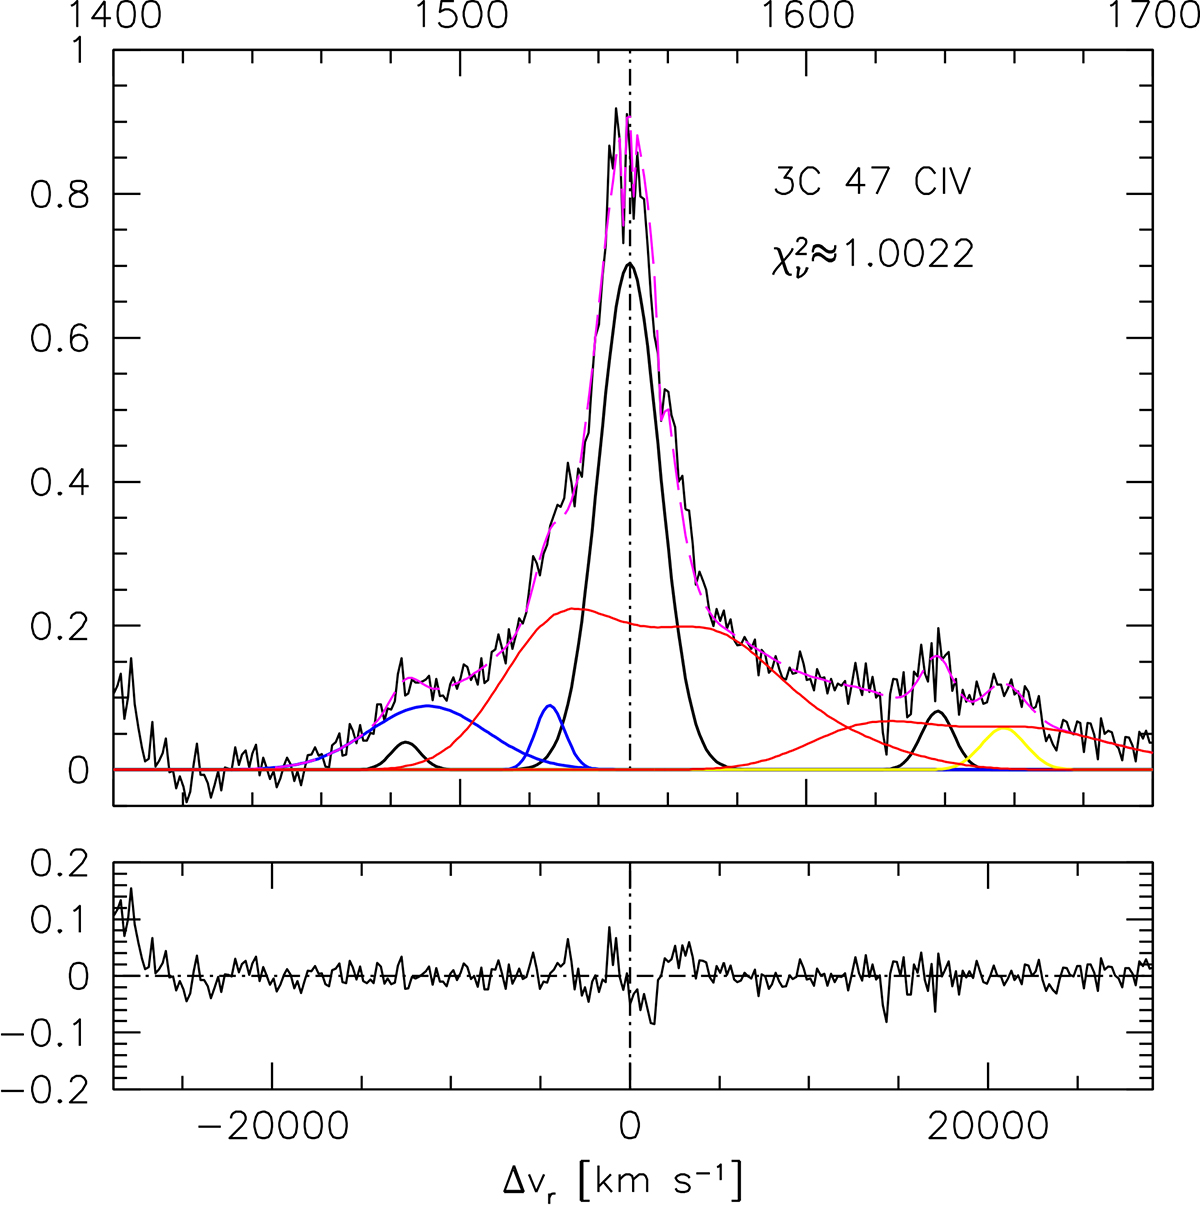
Multicomponent empirical analysis and AD model fitting results for CIVλ1549 and HeIIλ1640. The black line corresponds to the rest-frame spectrum, and the emission line components used in the empirical fit are the blueshifted components (blue) and BC (black). The red line represents the model fitting result for CIV and HeIIλ1640 by using the AD model fitting parameters of Hβ. The dashed magenta line shows the final model fitting from specfit. The lower panel shows the residuals.
Current usage metrics show cumulative count of Article Views (full-text article views including HTML views, PDF and ePub downloads, according to the available data) and Abstracts Views on Vision4Press platform.
Data correspond to usage on the plateform after 2015. The current usage metrics is available 48-96 hours after online publication and is updated daily on week days.
Initial download of the metrics may take a while.