Fig. 5.
Download original image
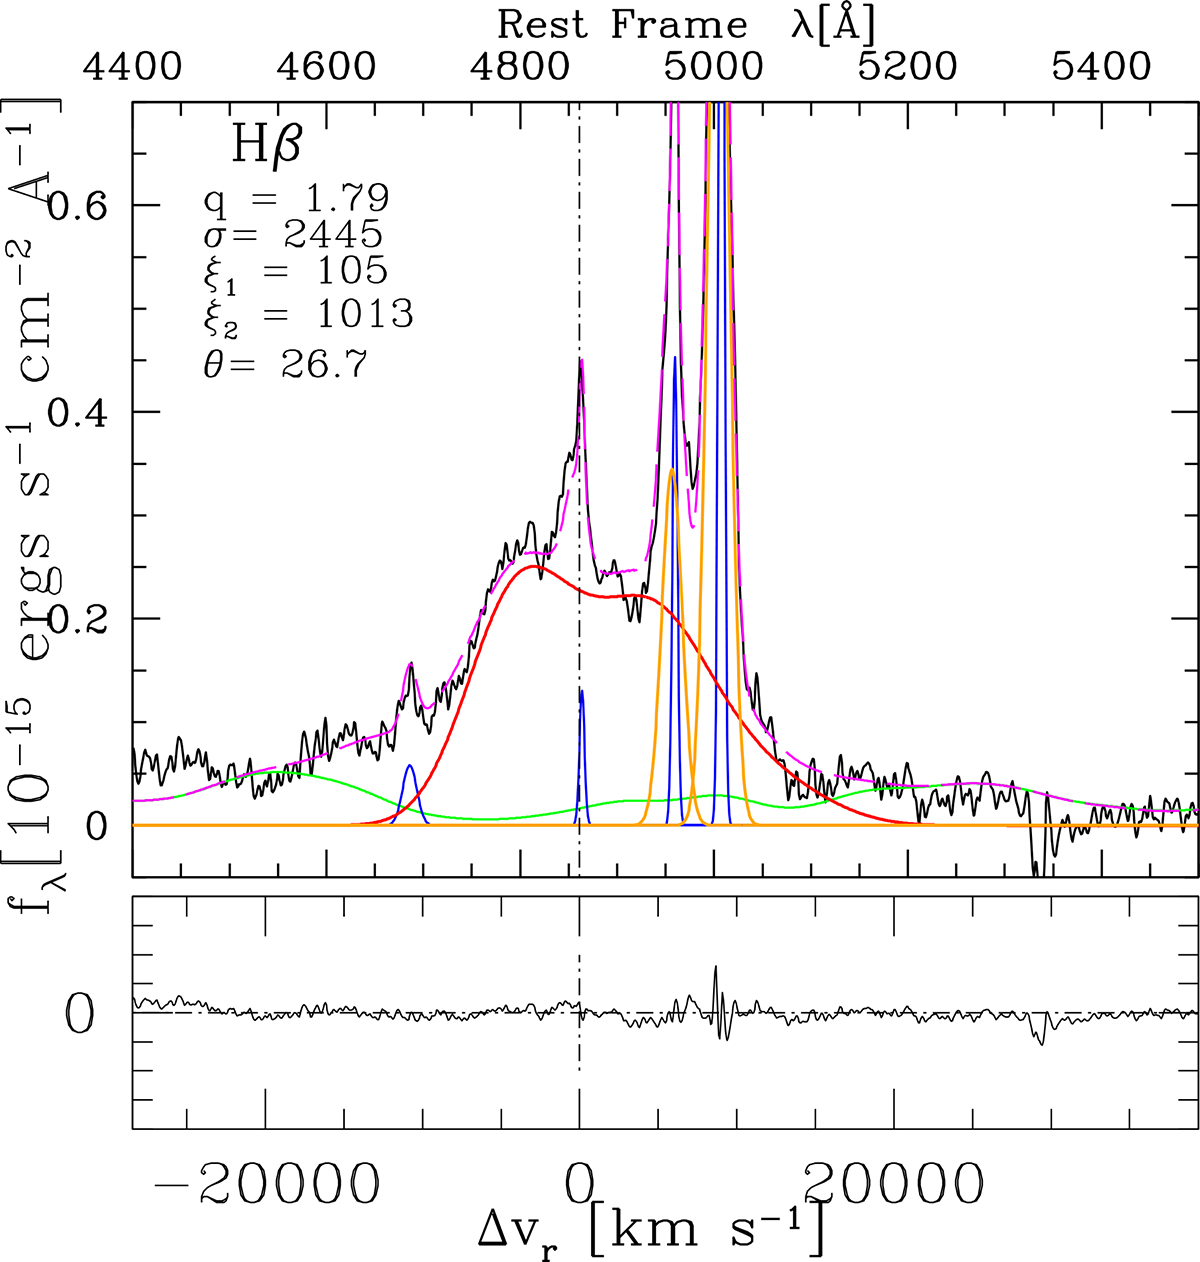
Multicomponent empirical specfit analysis, including the AD model fitting result in the Hβ region after subtracting the continuum from the best fit. The upper abscissa is the rest-frame wavelength in Å and the lower abscissa is in radial velocity units. The vertical scale corresponds to the specific flux in units of 10−15 ergs s−1 cm−2 Å−1. The emission line components used in the fit are FeII (green), the broad AD model representing the fit for the broad double-peaked profile (red line), SBC (orange), and NC (blue). The black continuous line corresponds to the rest-frame spectrum. The dashed magenta line shows the final fitting from specfit. The dot-dashed vertical lines trace the rest-frame wavelength of Hβ. The lower panel shows the residual of the empirical fit.
Current usage metrics show cumulative count of Article Views (full-text article views including HTML views, PDF and ePub downloads, according to the available data) and Abstracts Views on Vision4Press platform.
Data correspond to usage on the plateform after 2015. The current usage metrics is available 48-96 hours after online publication and is updated daily on week days.
Initial download of the metrics may take a while.