Open Access
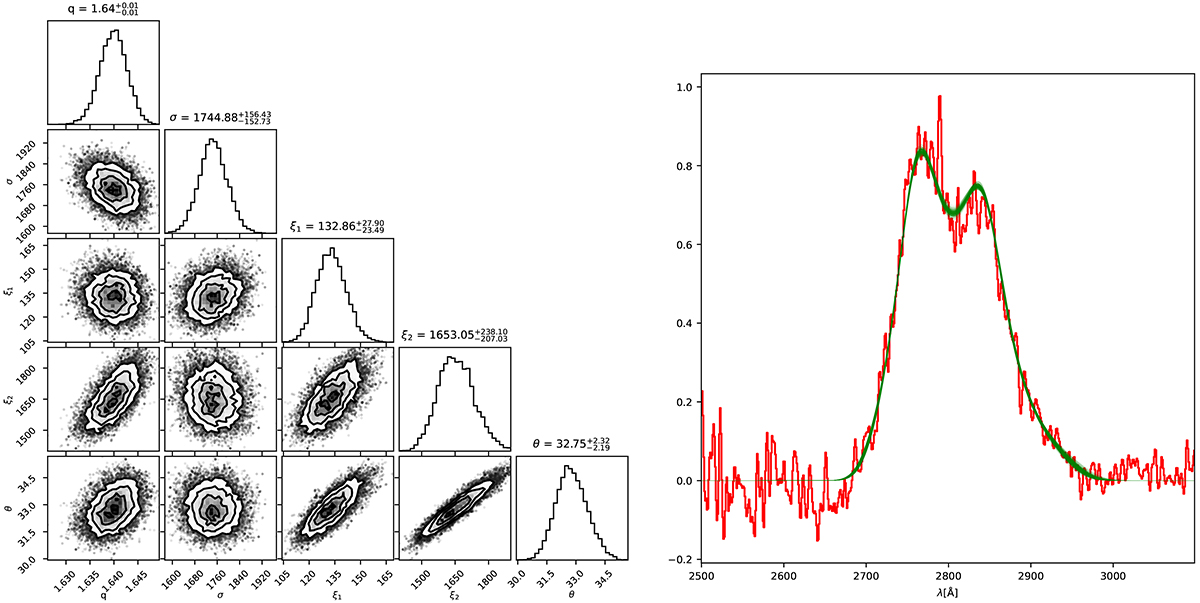
Fig. 3.
Download original image
Left: Corner plot showing the posterior distributions of the five AD parameters for MgII as histograms, along with covariance maps between the parameters. Right: 250 randomly selected posterior solutions from the Bayesian fit (green) superimposed onto the observed broad profile (red) of MgII.
Current usage metrics show cumulative count of Article Views (full-text article views including HTML views, PDF and ePub downloads, according to the available data) and Abstracts Views on Vision4Press platform.
Data correspond to usage on the plateform after 2015. The current usage metrics is available 48-96 hours after online publication and is updated daily on week days.
Initial download of the metrics may take a while.