Fig. 11.
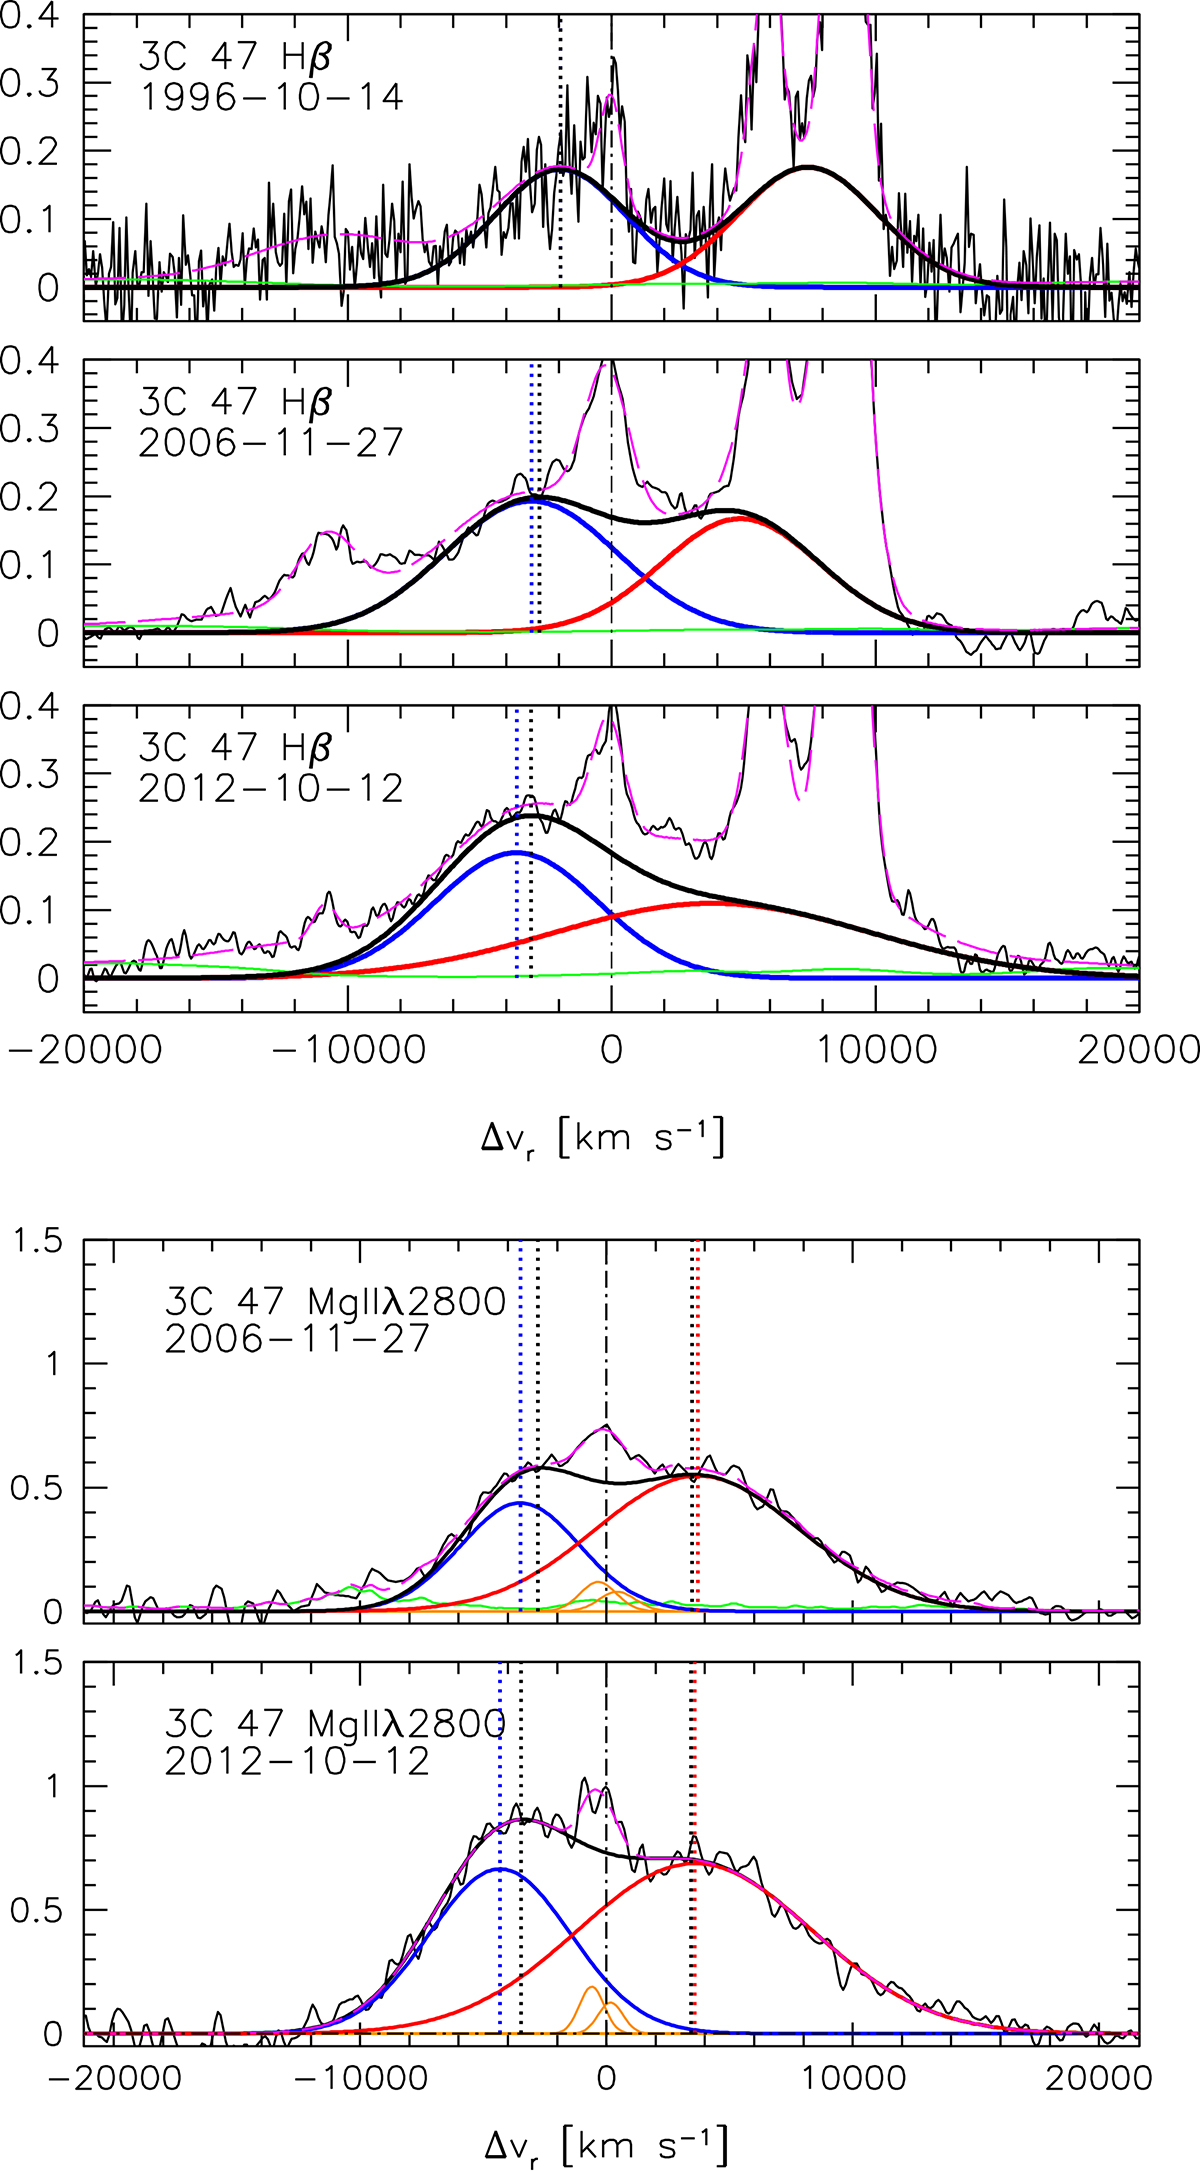
Download original image
Top: Multicomponent empirical specfit analysis results in the Hβ line region for three epochs after subtracting the power-law and the Balmer recombination continuum (the latter for the MgII spectral range). The abscissa is in radial velocity units. The vertical scale corresponds to the specific flux in units of 10−15 ergs s−1 cm−2 Å−1. The emission line components used in the fit are FeII (green), the blue- and red-peaked profiles (black), the VBC (red), and the full profile (sum of the two BCs and the VBC; thick black), all the NCs (blue), and [OIII]λλ4959,5007 SBC (orange). The continuous black lines correspond to the rest-frame spectrum. The dashed magenta line shows the model fitting from specfit. The dot-dashed vertical lines trace the rest-frame wavelength of Hβ. The dotted lines identify the radial velocity of the blue- and redshifted broad Gaussian components. Bottom: Same for the MgII line after removing the FeII emission for clarity.
Current usage metrics show cumulative count of Article Views (full-text article views including HTML views, PDF and ePub downloads, according to the available data) and Abstracts Views on Vision4Press platform.
Data correspond to usage on the plateform after 2015. The current usage metrics is available 48-96 hours after online publication and is updated daily on week days.
Initial download of the metrics may take a while.