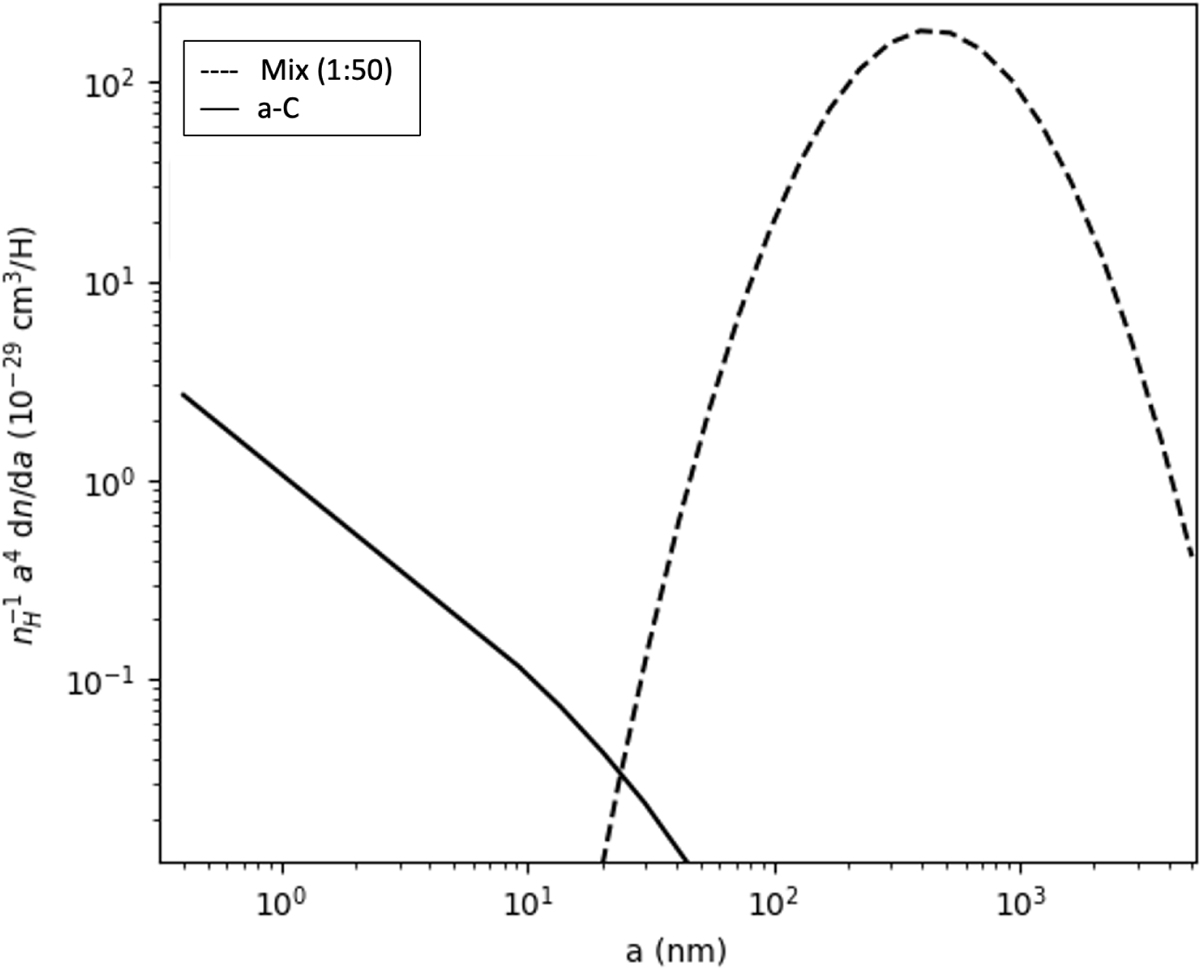
Fig. A.1
Download original image
Size distributions of the dust mixtures for a-C grains from THEMIS (solid black line) and large grains (i.e Mix 1:50 from Ysard et al. 2019, dash-dotted line). Those are illustrative of our starting point since the parameters defining them are fitted (e.g. minimum and maximum sizes, slope of the power-law distributions, peak of the log-normal distributions). This figure is produced using DustEM (Compiègne et al. 2011).
Current usage metrics show cumulative count of Article Views (full-text article views including HTML views, PDF and ePub downloads, according to the available data) and Abstracts Views on Vision4Press platform.
Data correspond to usage on the plateform after 2015. The current usage metrics is available 48-96 hours after online publication and is updated daily on week days.
Initial download of the metrics may take a while.