Fig. 8
Download original image
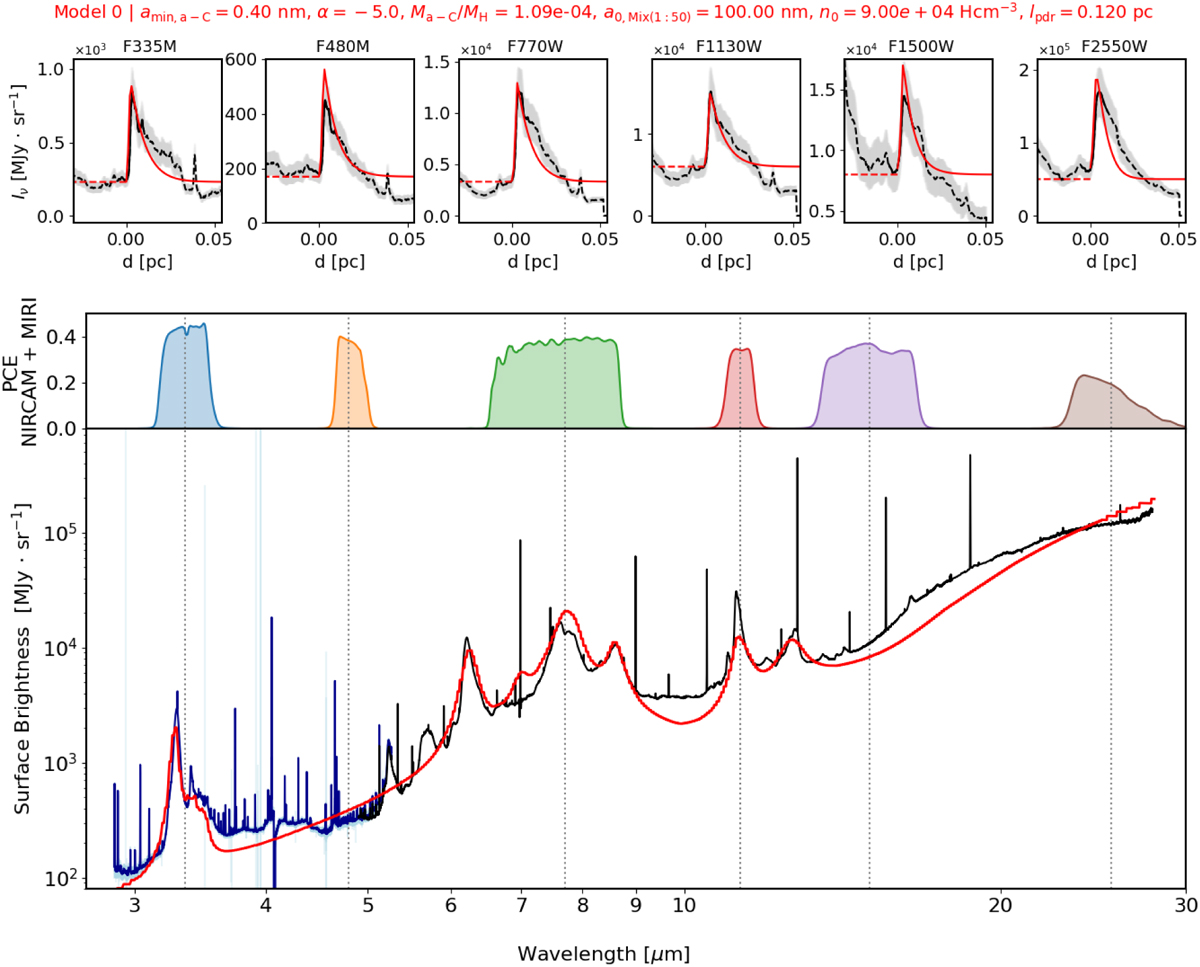
Comparison of the observed (JWST) and modelled dust emission in the atomic PDR region of the Orion Bar. Top: comparison of the observed and modelled dust emission profiles in the atomic PDR region of the Orion Bar, using the best set of dust parameters in six photometric bands (3.3 and 4.8 μm; NIRCam filters, and 7.7, 11.3, 15, and 25.5 μm; MIRI filters). The observed dust emission is shown in black and the model fit in red, with uncertainties of 20% displayed in grey. The observed emission that we model (indicated by the first steep increase at the IF position, followed by a slower decrease) is shown in solid black line, while the other components of the observed emission are represented by dashed lines as explained in Fig. 4. The cut is perpendicular across the Orion Bar, as shown in Fig. 1. Middle: wavelength coverage and photon-to-electron conversion efficiency (PCE) of the NIRCam and MIRI imager filters used in our study. Throughput refers to photon-to-electron conversion efficiency. The central wavelengths of the filters are indicated with dashed vertical lines. The name of each filter is indicated in the top figure. The values of central wavelengths and bandwidths are presented in Habart et al. (2024). Bottom: comparison of the dust emission spectral energy distribution (SED) calculated using our radiative transfer model at the AIB peak emission at a distance of 0.003 pc (represented by the red line), with template spectra for the atomic PDR in the Orion Bar from Peeters et al. (2024; shown in dark blue for NIRSpec and black for MRS) in the wavelength range of 2.75 to 28 μm.
Current usage metrics show cumulative count of Article Views (full-text article views including HTML views, PDF and ePub downloads, according to the available data) and Abstracts Views on Vision4Press platform.
Data correspond to usage on the plateform after 2015. The current usage metrics is available 48-96 hours after online publication and is updated daily on week days.
Initial download of the metrics may take a while.