Fig. 6
Download original image
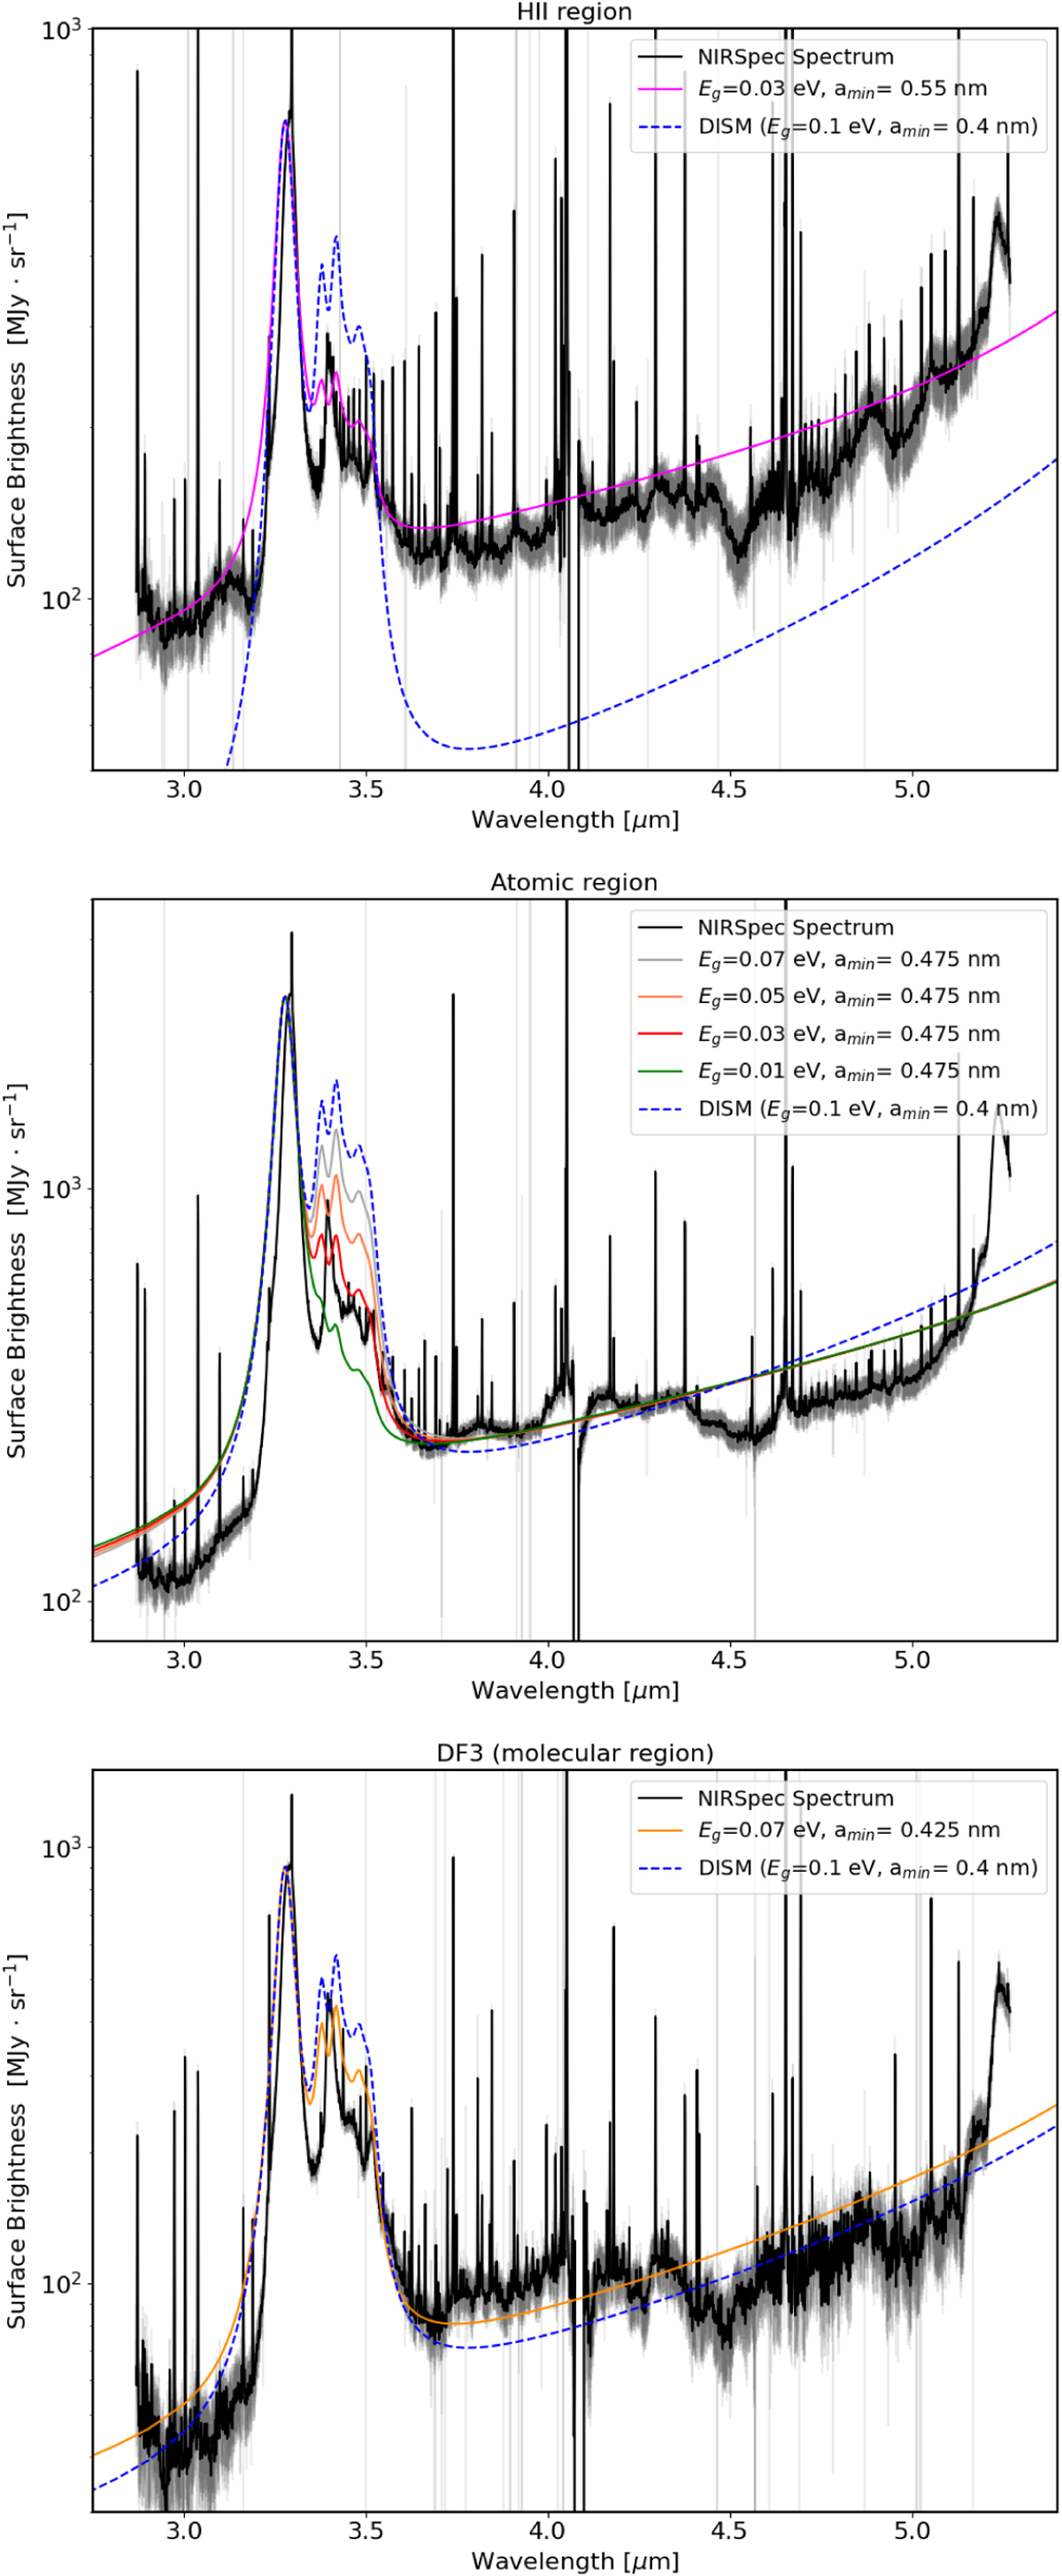
Comparison of observed surface brightness and DustEM models normalized to the 3.3 μm observed band (without radiative transfer) in the H II (upper), atomic (middle), and DF3 (lower) regions. The black data points represent observations from NIRSpec, while the coloured lines show model predictions with varying band gap energies. In each figure, the DISM model is shown in blue dashed line and the best models for the H II, atomic, and DF3 regions are shown in magenta, red, orange respectively.
Current usage metrics show cumulative count of Article Views (full-text article views including HTML views, PDF and ePub downloads, according to the available data) and Abstracts Views on Vision4Press platform.
Data correspond to usage on the plateform after 2015. The current usage metrics is available 48-96 hours after online publication and is updated daily on week days.
Initial download of the metrics may take a while.