Fig. 4
Download original image
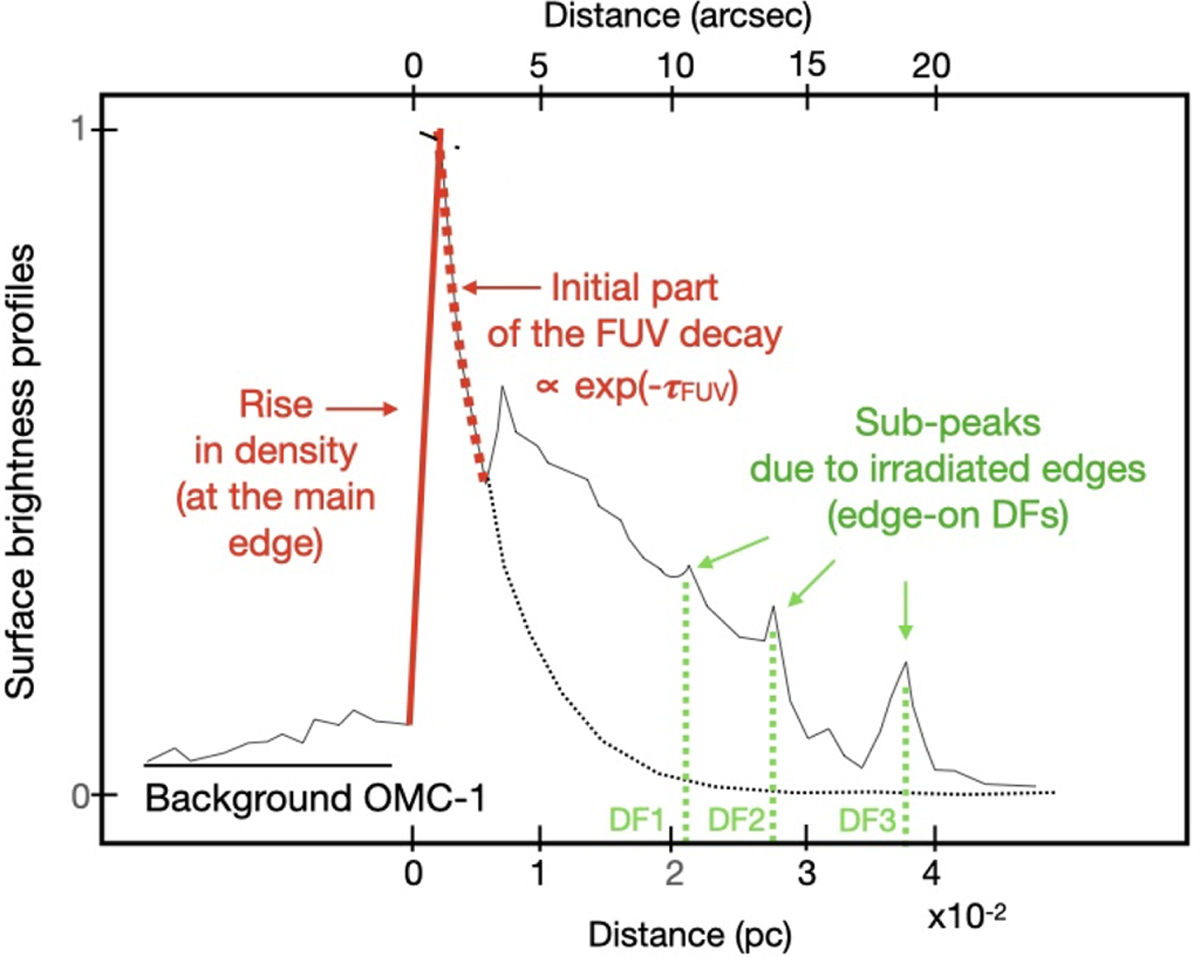
Adapted from Habart et al. (2024). Schematic diagram illustrating the different components observed in the AIB surface brightness profile perpendicular to the Orion Bar. These components are shown for filter F335M (same as in Fig. 2). In this study, we focus on modelling the first steep increase at the IF position, followed by a slower decrease indicated by the red line. The positions of DF1, DF2, and DF3 correspond to peaks in H2 emission.
Current usage metrics show cumulative count of Article Views (full-text article views including HTML views, PDF and ePub downloads, according to the available data) and Abstracts Views on Vision4Press platform.
Data correspond to usage on the plateform after 2015. The current usage metrics is available 48-96 hours after online publication and is updated daily on week days.
Initial download of the metrics may take a while.