Fig. 2
Download original image
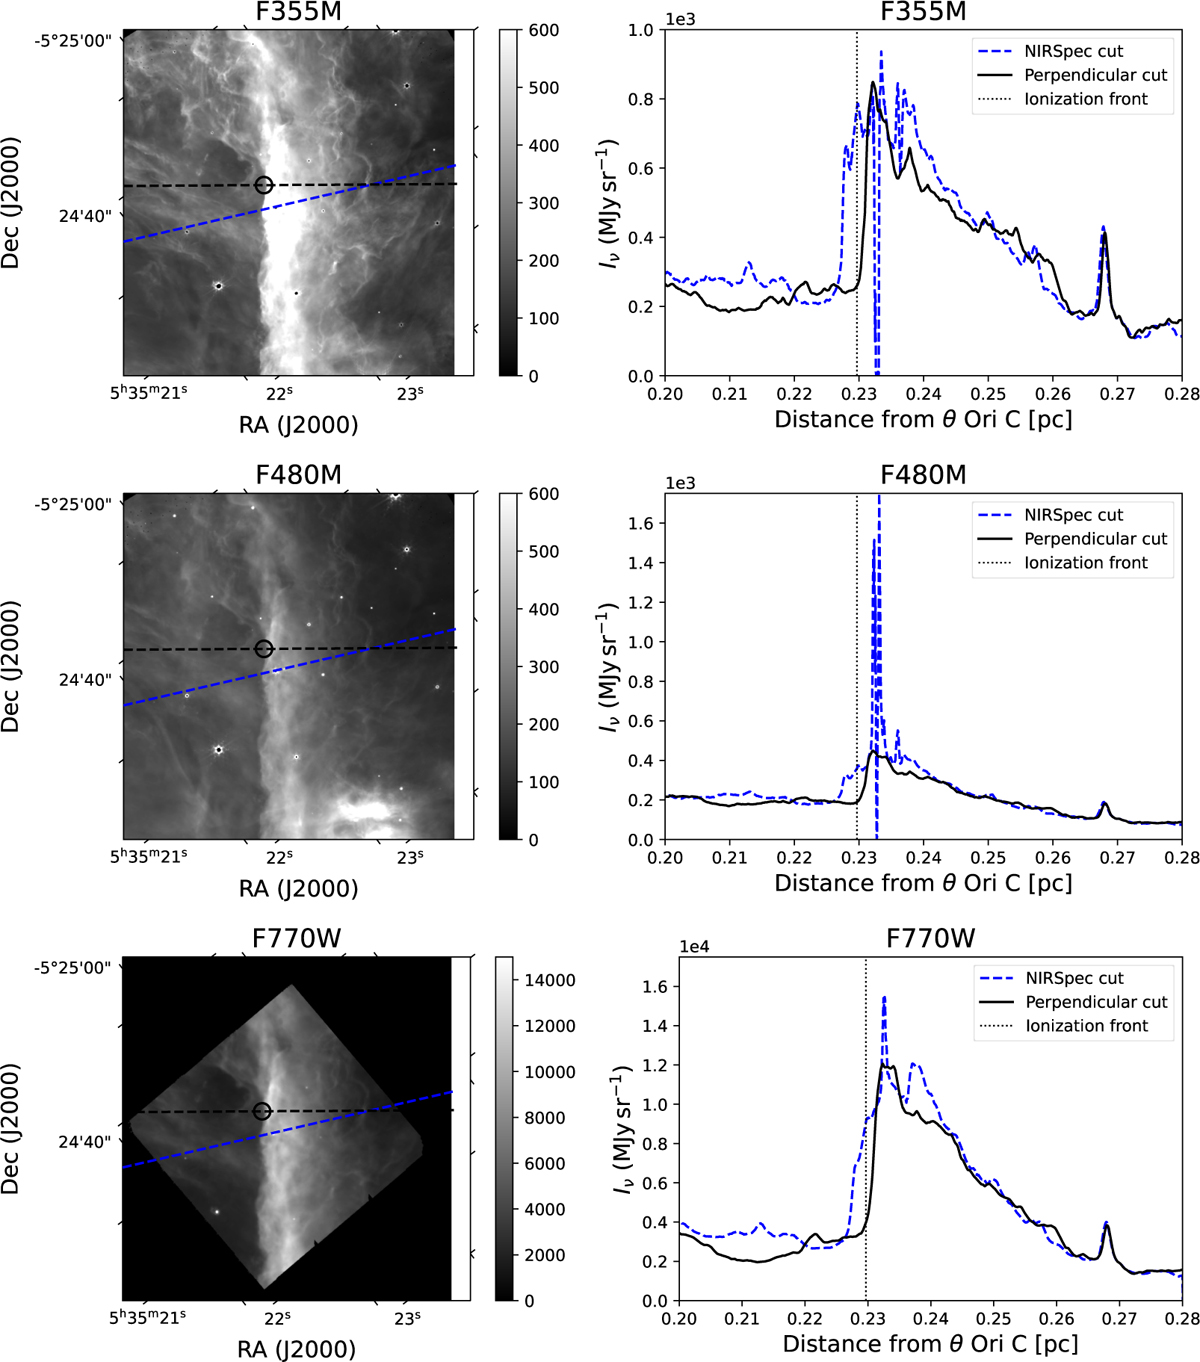
Spatial distribution of the NIRCam (F335M and F480M) and MIRI (F770W) Alters tracing the AIBs at 3.35, 4.8, and 7.7 μm and continuum dust emission. Left: maps in the NIRCam (F335M and F480M) and MIRI (F770W) filters on a rotated Bar where the ionizing radiation is incident from the left. The blue inclined line shows the cut obtained from the NIRSpec field and the black line indicates the cut perpendicular to the Bar. A black circle shows the position of the IF for the perpendicular cut. Right: surface brightness profiles in the NIRCam and MIRI filters as a function of distance from the IF for perpendicular and NIRSpec cuts, with the average position of the IF marked by black vertical dash-dotted lines. Units are in MJy sr−1. The observed very high pixel values are attributed to the NIRSpec cut crossing two proplyds, which affects the distribution of pixel intensities in this region.
Current usage metrics show cumulative count of Article Views (full-text article views including HTML views, PDF and ePub downloads, according to the available data) and Abstracts Views on Vision4Press platform.
Data correspond to usage on the plateform after 2015. The current usage metrics is available 48-96 hours after online publication and is updated daily on week days.
Initial download of the metrics may take a while.