Fig. B.1
Download original image
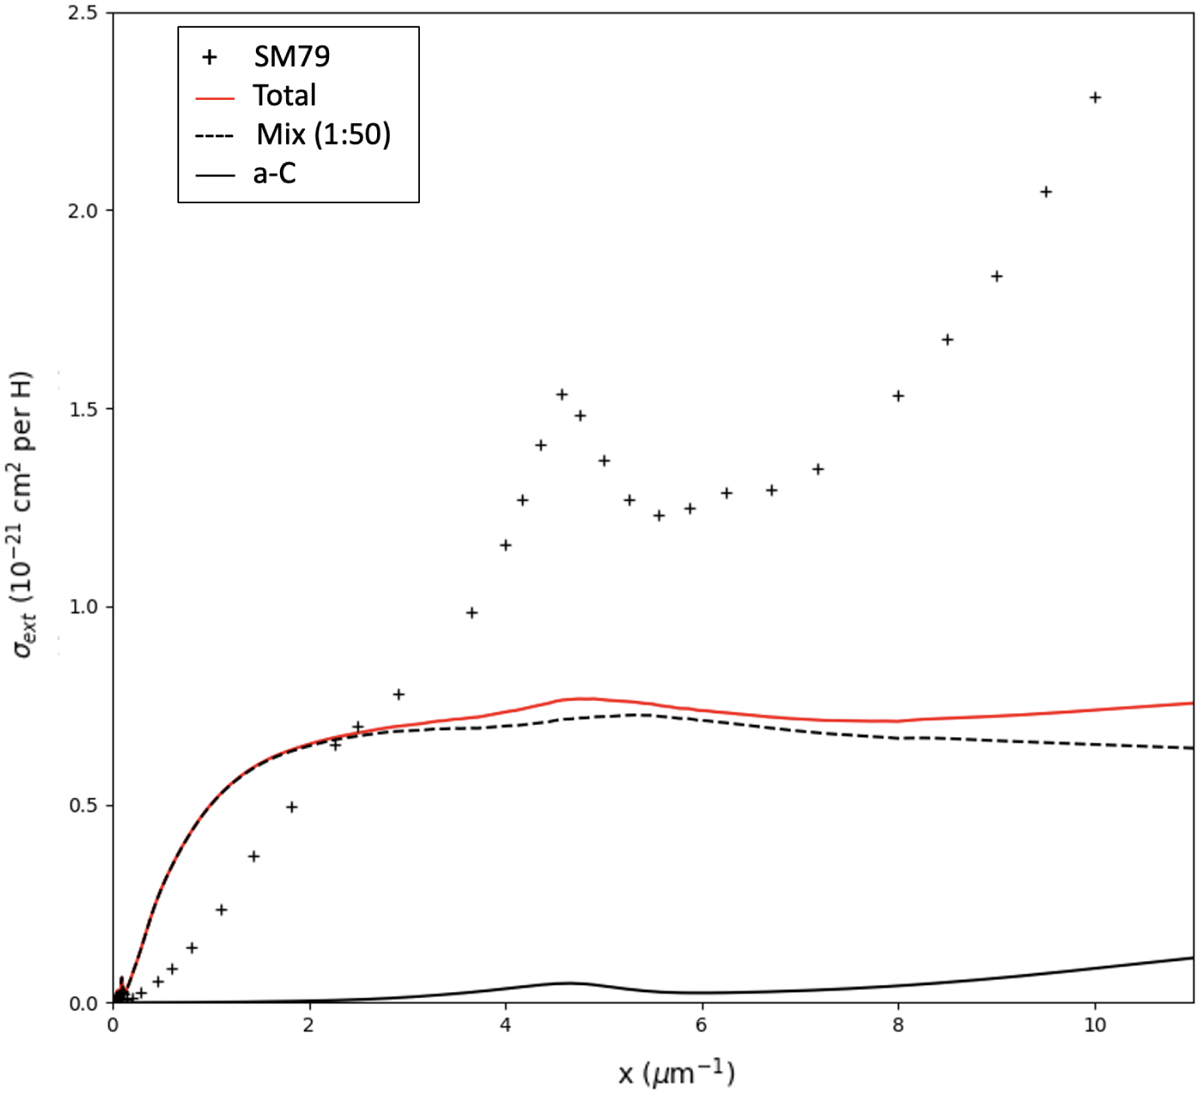
UV extinction curve resulting from the grain distribution with the best parameters from our self-consistent model of the atomic region (red line). The contributions from the two grain distribution components are also shown in dashed black line for pseudo-aggregates and in solid black line for nano-grains a-C. For comparison, the standard extinction curve from Savage & Mathis (1979) (SM79) is represented by black cross symbols. The figure is produced using DustEM (Compiègne et al. 2011).
Current usage metrics show cumulative count of Article Views (full-text article views including HTML views, PDF and ePub downloads, according to the available data) and Abstracts Views on Vision4Press platform.
Data correspond to usage on the plateform after 2015. The current usage metrics is available 48-96 hours after online publication and is updated daily on week days.
Initial download of the metrics may take a while.