Open Access
Fig. 7
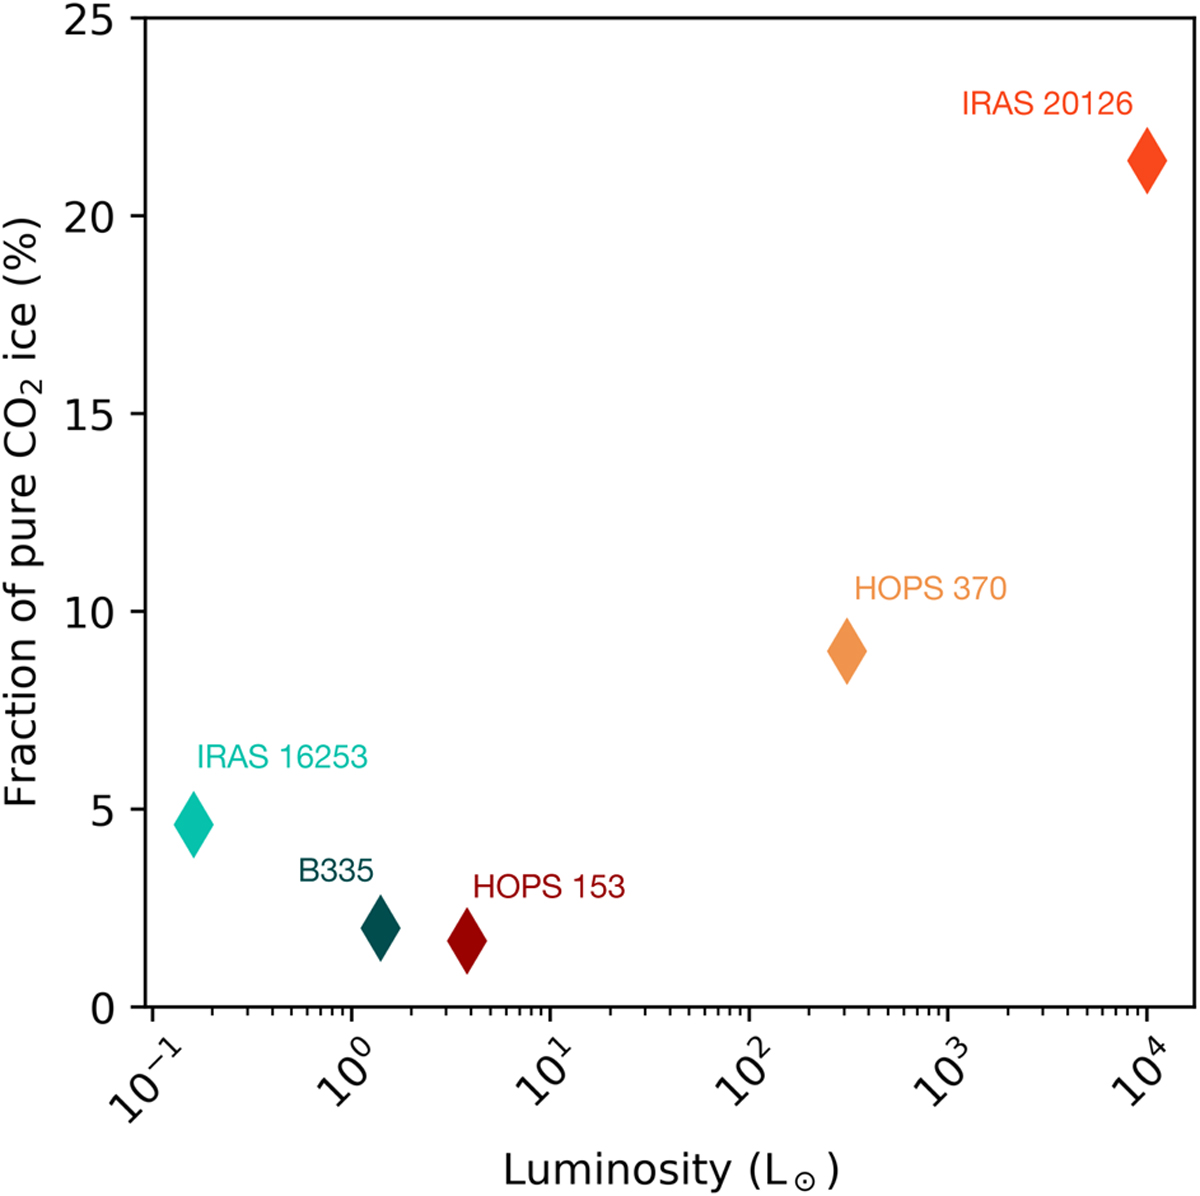
Download original image
Fraction of pure CO2 contributing to the total 13CO2 ice band for the five different targets in this sample. The luminosity of each source is plotted in log-scale on the x-axis.
Current usage metrics show cumulative count of Article Views (full-text article views including HTML views, PDF and ePub downloads, according to the available data) and Abstracts Views on Vision4Press platform.
Data correspond to usage on the plateform after 2015. The current usage metrics is available 48-96 hours after online publication and is updated daily on week days.
Initial download of the metrics may take a while.