Fig. 5
Download original image
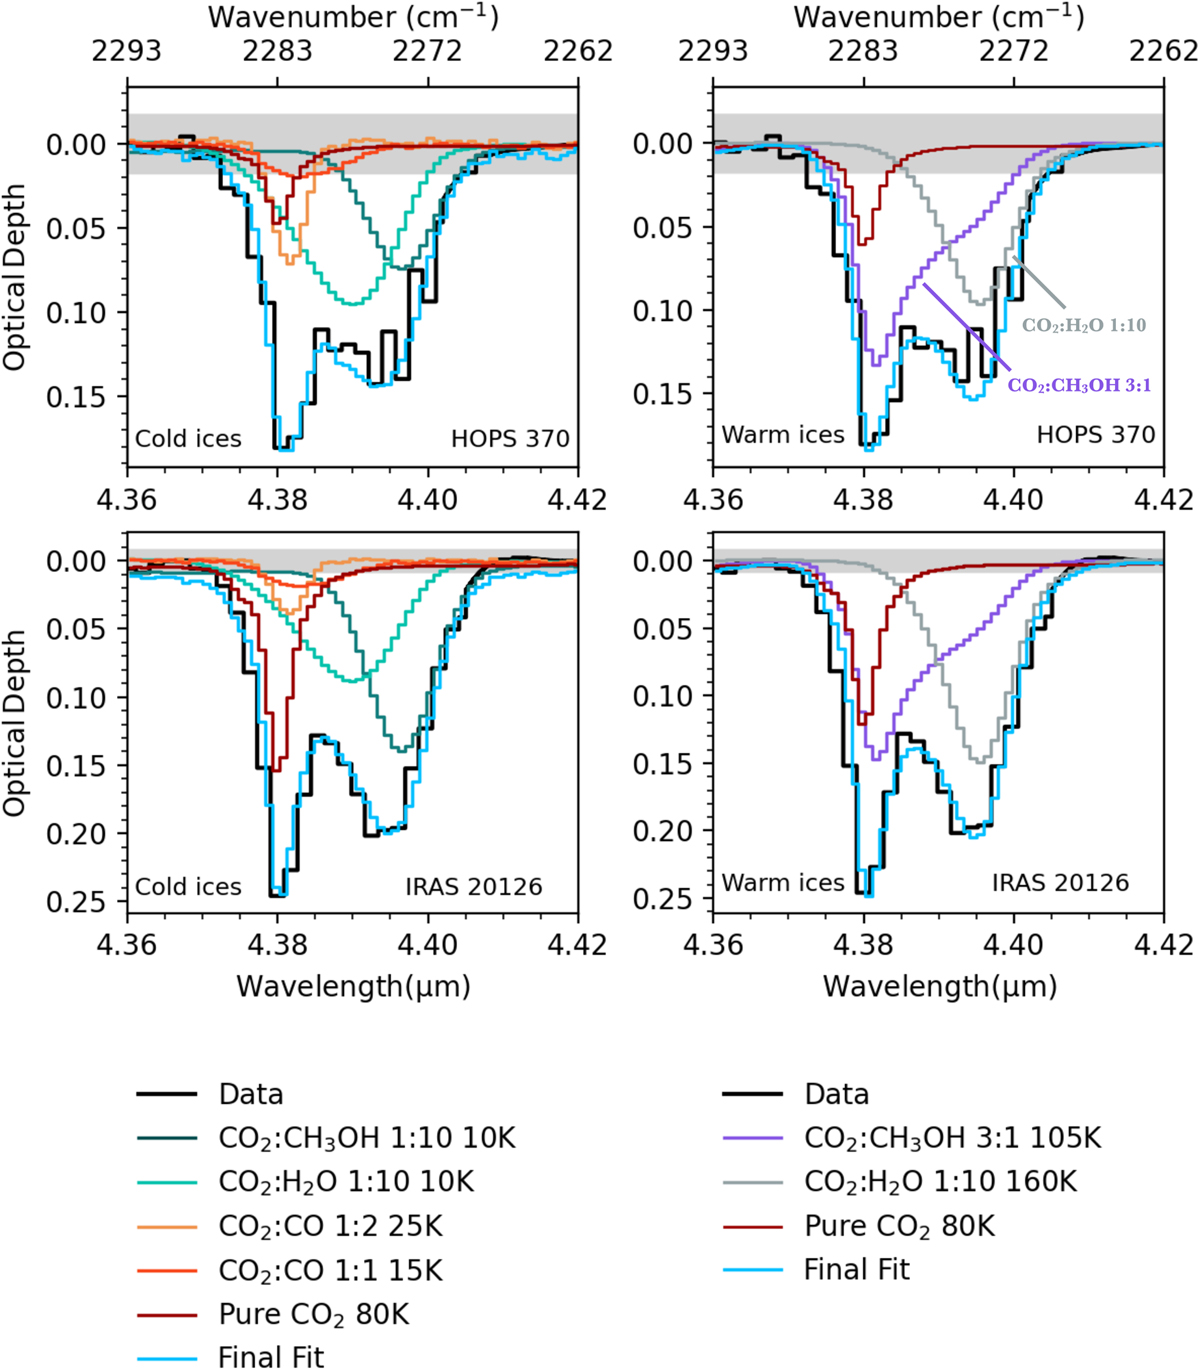
Alternative spectral analysis for HOPS 370 with high temperature ice species. The black line shows the observed spectrum, and the blue line shows the linear combination of all five different components. The purple line corresponds to the hot CO2:CH3OH component. The solid gray line shows the contribution of the hot CO2:H2O component. Finally, the dark red line corresponds to the pure CO2 component. The shaded area shows the 3σ rms in optical depth scale.
Current usage metrics show cumulative count of Article Views (full-text article views including HTML views, PDF and ePub downloads, according to the available data) and Abstracts Views on Vision4Press platform.
Data correspond to usage on the plateform after 2015. The current usage metrics is available 48-96 hours after online publication and is updated daily on week days.
Initial download of the metrics may take a while.