Fig. 3
Download original image
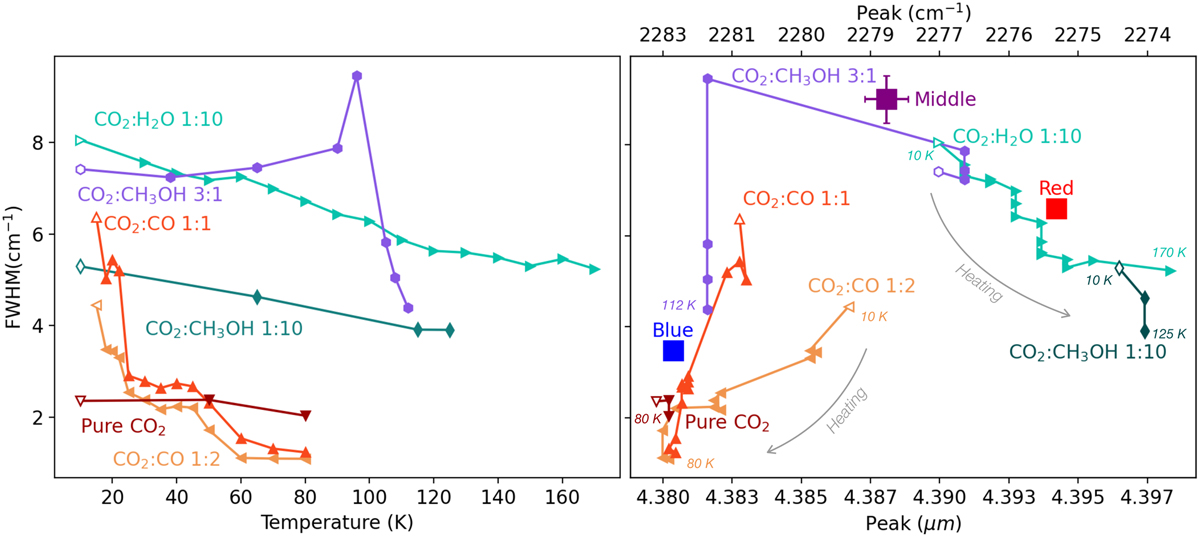
Properties of the laboratory spectra used in this work. Left panel: FWHM as a function of the temperature for the ice mixtures. The band profile narrows or broadens with increasing temperature depending on the ice sample. Right panel: FWHM plotted against the peak position. The peak centers of the CO2:H2O (aquamarine) and CO2:CH3OH (dark green) polar ices shift to longer wavelengths as the ice is heated. Similarly, the peak center of pure CO2 ice also shifts to longer wavelengths with increasing temperature (dark red). The apolar CO2:CO (gold and orange) ices show the opposite behavior, with peaks shifting to shorter wavelengths as a function of temperature. The blue, red, and purple squares show the FWHM and peak positions of the fitted Gaussian profiles.
Current usage metrics show cumulative count of Article Views (full-text article views including HTML views, PDF and ePub downloads, according to the available data) and Abstracts Views on Vision4Press platform.
Data correspond to usage on the plateform after 2015. The current usage metrics is available 48-96 hours after online publication and is updated daily on week days.
Initial download of the metrics may take a while.