Fig. 2
Download original image
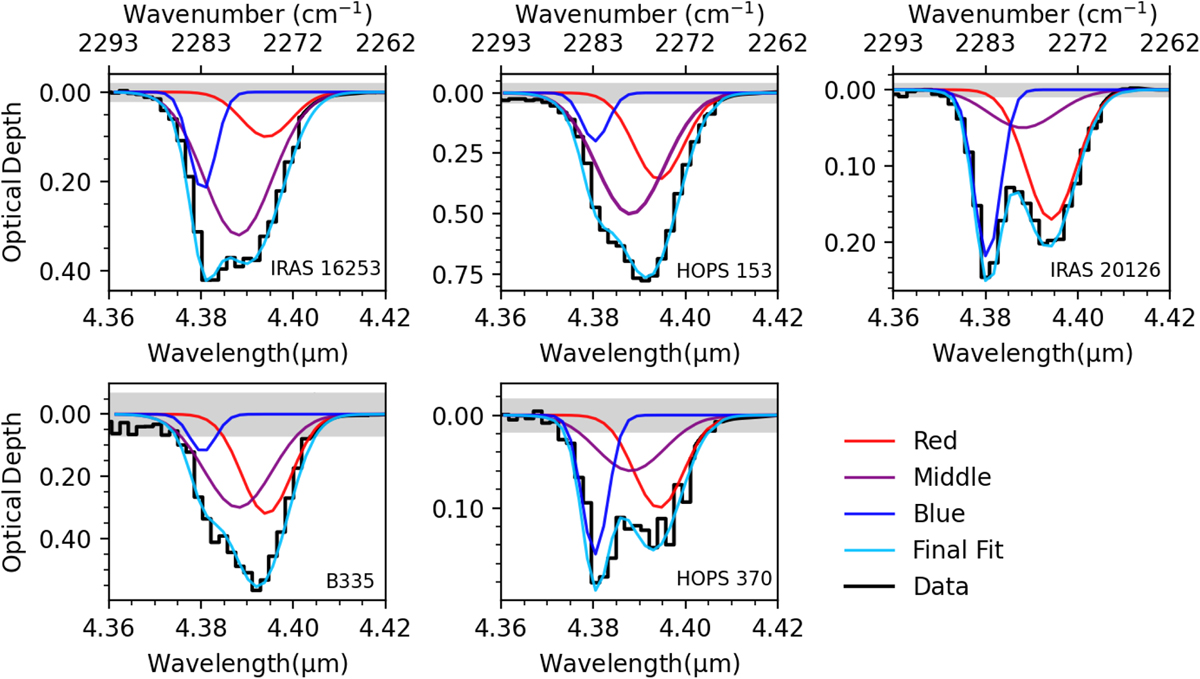
Spectral decomposition of the 13CO2 bands using Gaussian profiles. The final fit is a linear combination of the three Gaussian curves, as indicated by the light blue line. The shaded area shows the rms in optical depth scale. After identifying the three components, the widths and central positions of the profiles are fixed for all five sources, leaving the relative optical depths of the components of the individual components as the only variables.
Current usage metrics show cumulative count of Article Views (full-text article views including HTML views, PDF and ePub downloads, according to the available data) and Abstracts Views on Vision4Press platform.
Data correspond to usage on the plateform after 2015. The current usage metrics is available 48-96 hours after online publication and is updated daily on week days.
Initial download of the metrics may take a while.