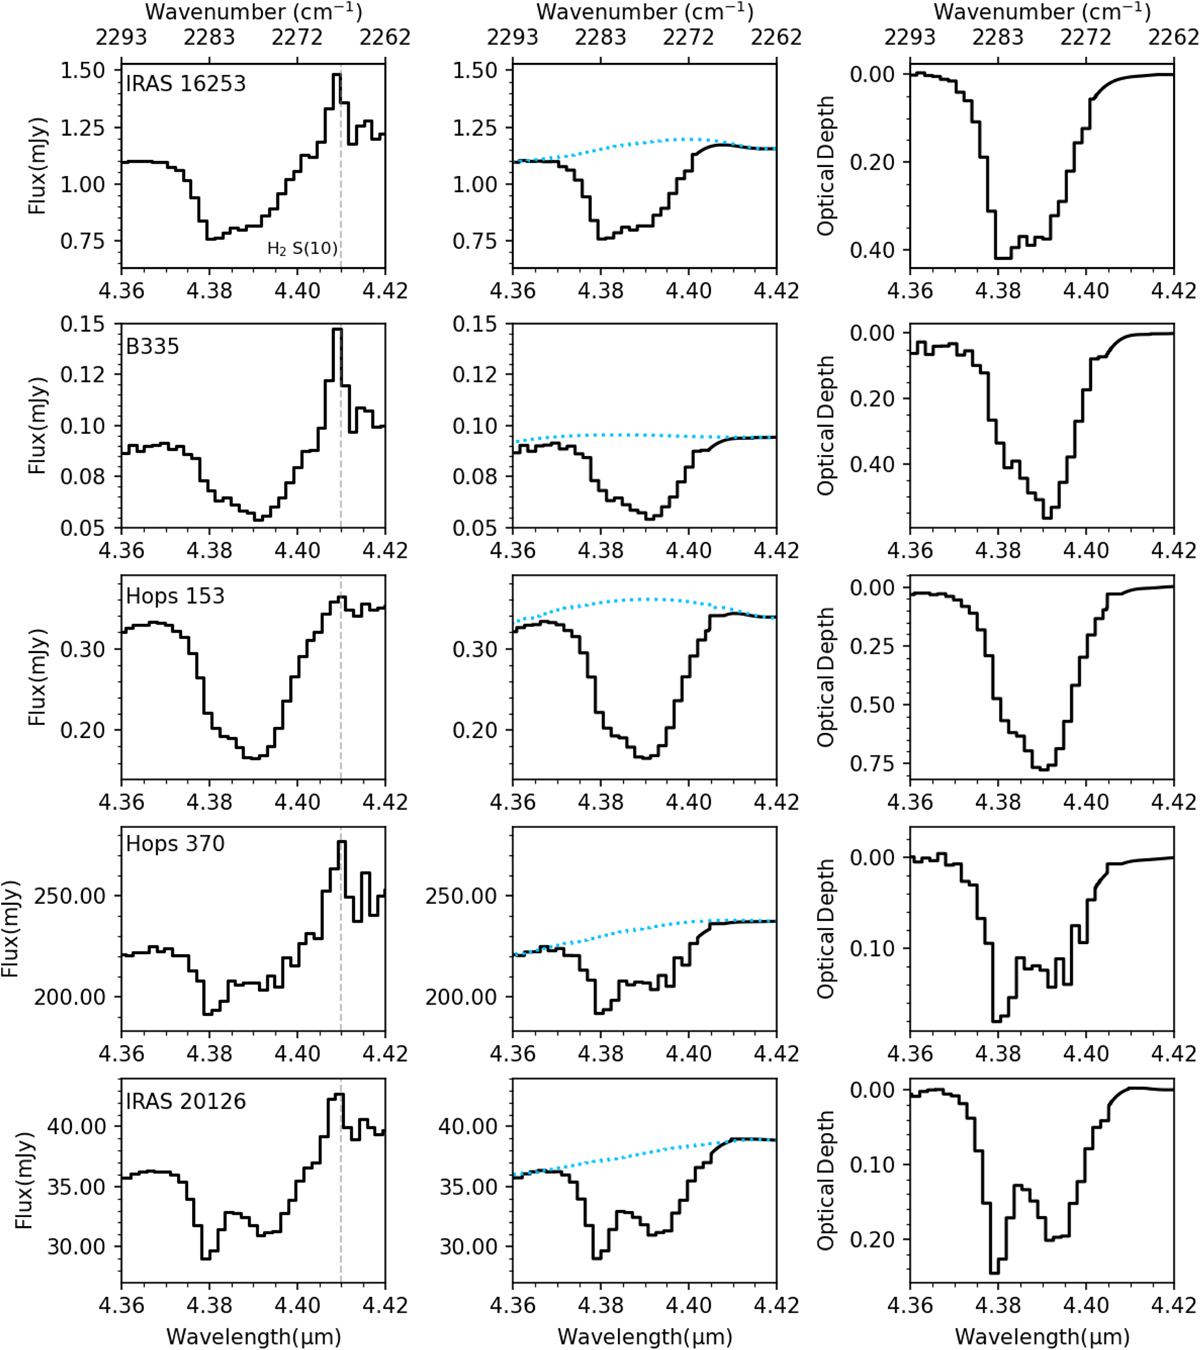
Fig. 1
Download original image
Overview of the 13CO2 ice feature toward the IPA sources studied in this work in order of increasing source luminosity. First column: data before subtracting the H2 and the CO ro-vibrational lines and the continuum. The dashed gray line shows the position of the H2 0–0 S(10) emission line. Second column: bands after subtracting CO gas-phase lines. The dotted blue line shows the local continuum that was traced for each band. Third column: bands in optical depth scale after continuum subtraction.
Current usage metrics show cumulative count of Article Views (full-text article views including HTML views, PDF and ePub downloads, according to the available data) and Abstracts Views on Vision4Press platform.
Data correspond to usage on the plateform after 2015. The current usage metrics is available 48-96 hours after online publication and is updated daily on week days.
Initial download of the metrics may take a while.