Fig. 9.
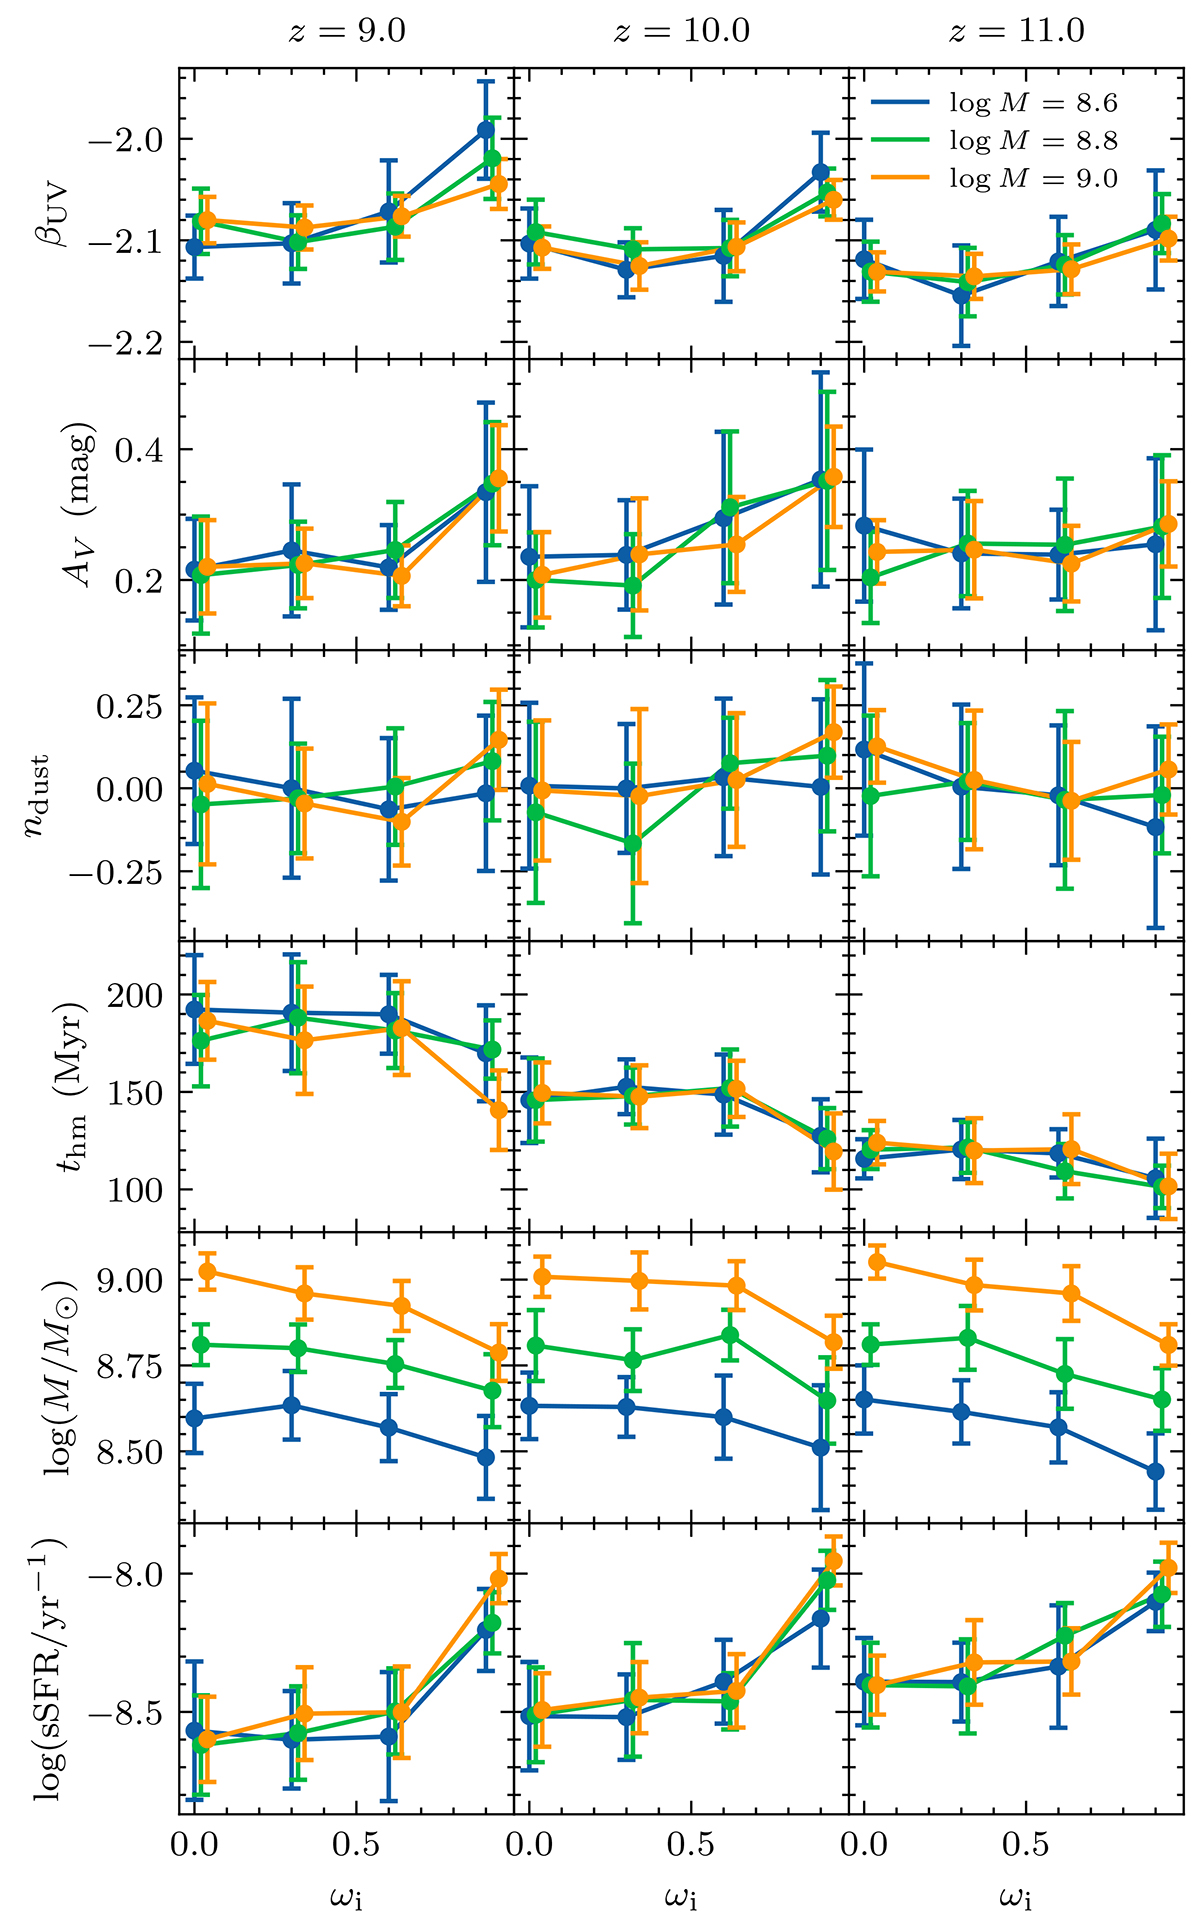
Download original image
Dependence of the derived physical quantities on the initial rotation rates, showing UV slope (β), dust attenuation in the V band (AV), dust index (n), half-mass time (the lookback time at which 50% of the stellar mass formed), stellar mass, and specific star formation rate. The mock galaxies are generated with an SPS model of a non-rotating model (ωi = 0.0), and the physical quantities of these mock galaxies are then estimated with models of different rotation rates (ωi = 0.0, 0.3, 0.6, and 0.9). For each quantity, the results are grouped into three redshifts from z = 9.0 to 11.0. The colored curves represent the results binned by log(M/M⊙), with legends shown in the top-right subplot. A minor shift is applied to ωi for better visualization.
Current usage metrics show cumulative count of Article Views (full-text article views including HTML views, PDF and ePub downloads, according to the available data) and Abstracts Views on Vision4Press platform.
Data correspond to usage on the plateform after 2015. The current usage metrics is available 48-96 hours after online publication and is updated daily on week days.
Initial download of the metrics may take a while.