Open Access
Fig. 3.
Download original image
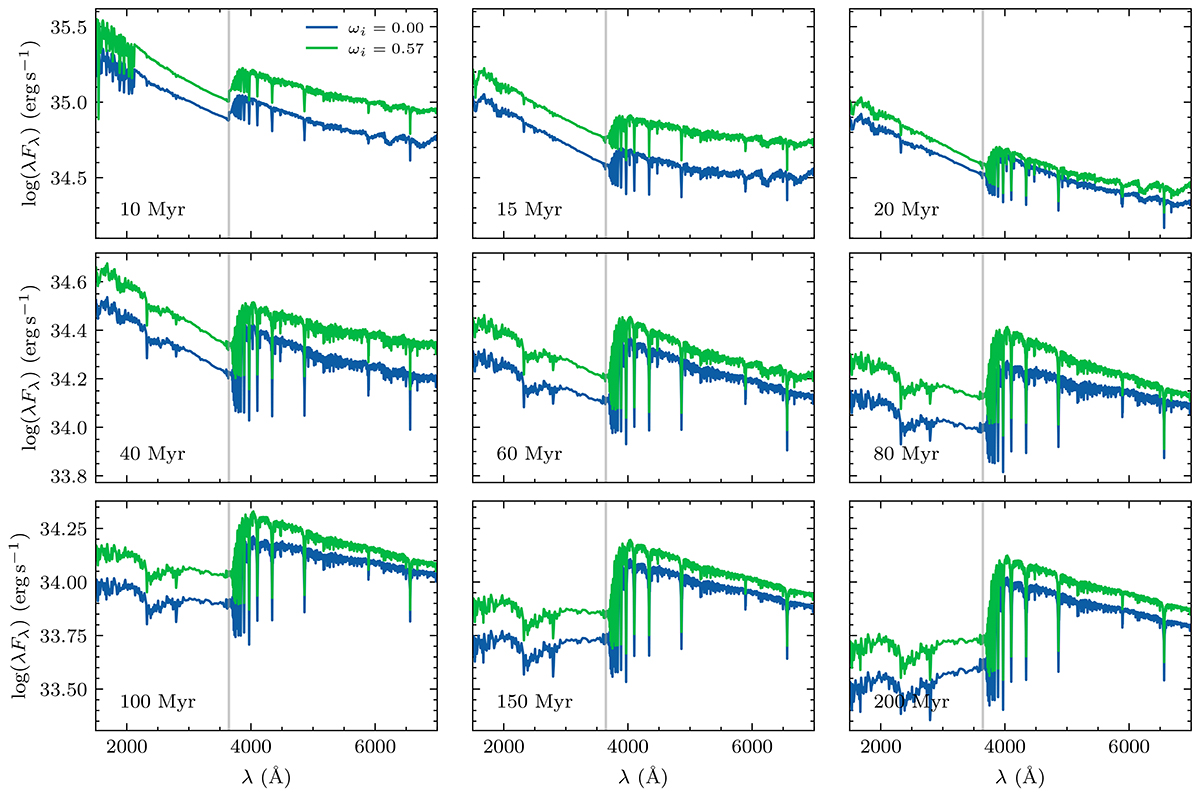
Time evolution of SED predictions for an SSP at solar metallicity ([Fe/H] = 0) from GENEVA models. The spectra have been normalized to an initial total mass of 1 M⊙. Different colors represent different initial rotation rates, denoted as ωi. The gray vertical lines highlight the wavelength of the Balmer jump at 3645 Å.
Current usage metrics show cumulative count of Article Views (full-text article views including HTML views, PDF and ePub downloads, according to the available data) and Abstracts Views on Vision4Press platform.
Data correspond to usage on the plateform after 2015. The current usage metrics is available 48-96 hours after online publication and is updated daily on week days.
Initial download of the metrics may take a while.