Open Access
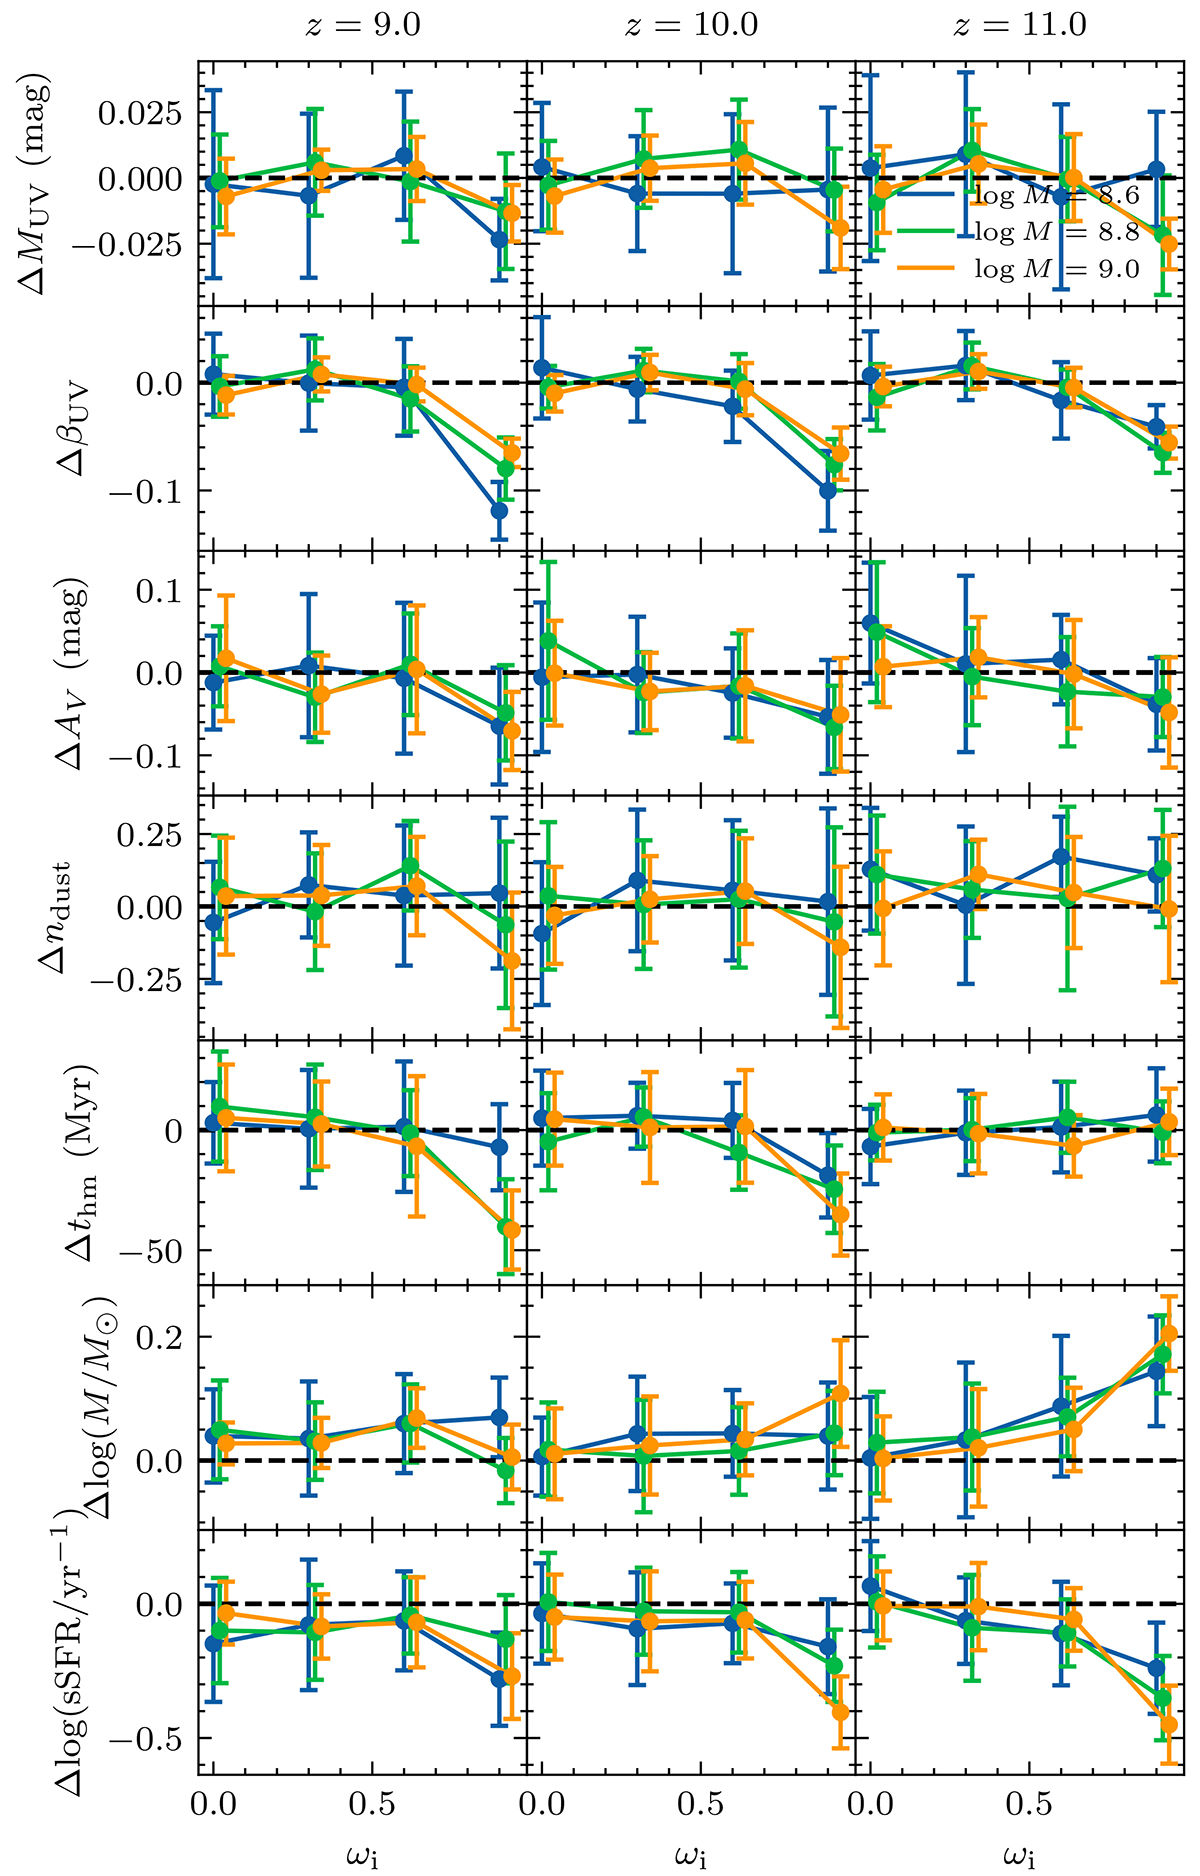
Fig. 13.
Download original image
Similar to Fig. 9, but showing differences (ΔX ≡ X − Xinput) between derived and input physical parameters. The mock galaxies were generated based on SPS models with different rotation rates but fit using a nonrotating SPS model. Δ = 0 is represented by the horizontal dashed lines.
Current usage metrics show cumulative count of Article Views (full-text article views including HTML views, PDF and ePub downloads, according to the available data) and Abstracts Views on Vision4Press platform.
Data correspond to usage on the plateform after 2015. The current usage metrics is available 48-96 hours after online publication and is updated daily on week days.
Initial download of the metrics may take a while.