Fig. 12.
Download original image
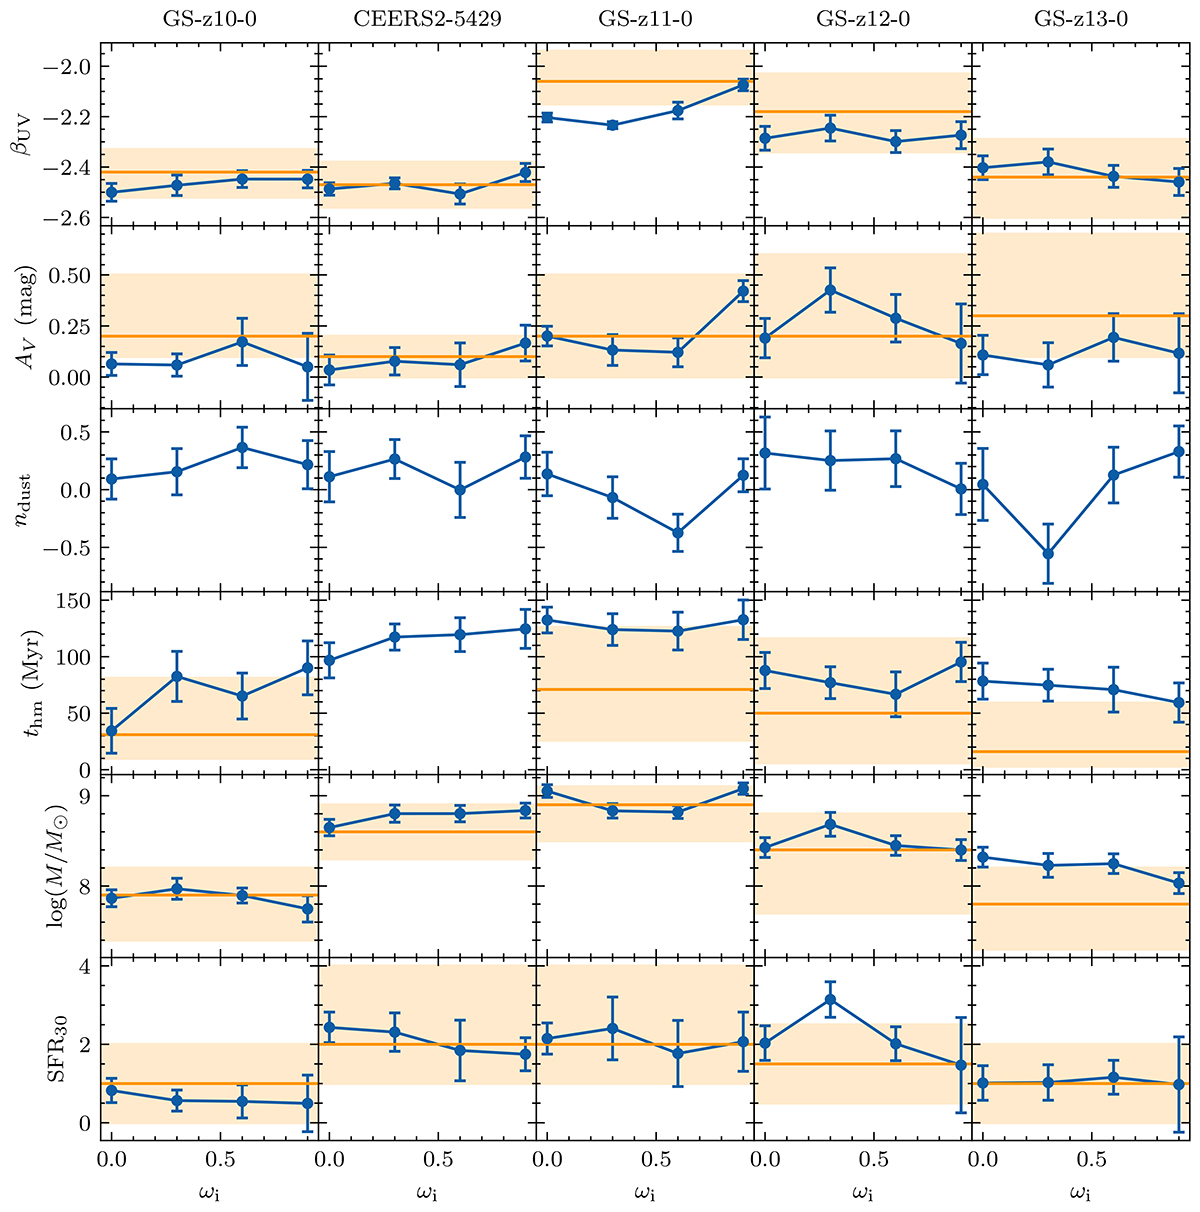
Derived physical quantities of five spectroscopically confirmed high-redshift galaxies from SPS models with different rotation rates. The galaxies are ordered by their spectroscopic redshift (zspec) from left to right. The error of the derived quantities was estimated via bootstrapping, as described in Fig. 9. The orange horizontal lines and the shadowed region around them represent the best-fit results and 1σ uncertainties obtained from Robertson et al. (2023) and Arrabal Haro et al. (2023), which were fit using Prospector with the MIST stellar evolution models (Choi et al. 2016).
Current usage metrics show cumulative count of Article Views (full-text article views including HTML views, PDF and ePub downloads, according to the available data) and Abstracts Views on Vision4Press platform.
Data correspond to usage on the plateform after 2015. The current usage metrics is available 48-96 hours after online publication and is updated daily on week days.
Initial download of the metrics may take a while.