Fig. 11.
Download original image
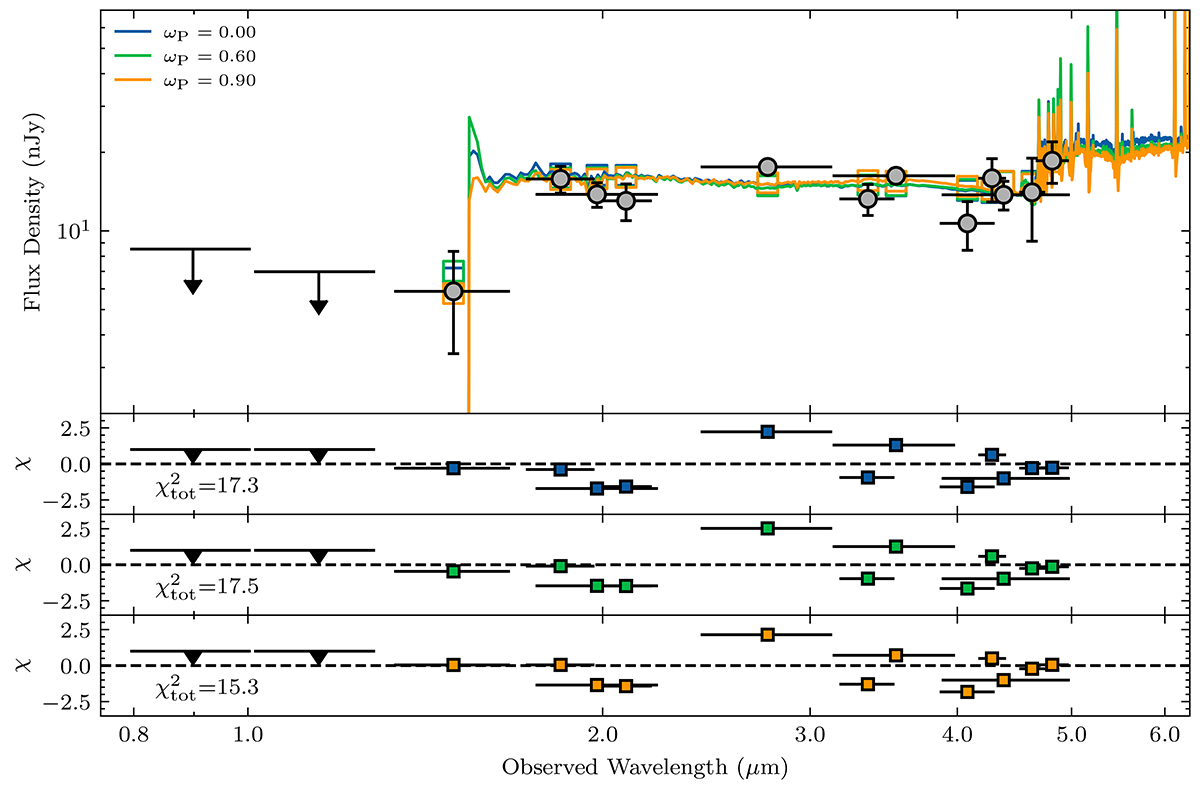
SED modeling of galaxy GS-z11-0 (z = 11.58) with PARSEC models incorporating different rotation rates. The observational data used in the SED fitting are shown in the top panels. The detected filters are represented by gray circles with horizontal error bars indicating the approximate wavelength range of each filter. For pass bands below the detection limit, their upper limits are indicated by bars with an arrow pointing down at 5σ significance. The blue, green, and orange lines represent the best-fitting SEDs predicted from PARSEC models with rotation rates of ωP, i = 0.0, 0.6, and 0.9, respectively. The boxes mark the posterior fluxes in the different filters. The bottom panels show the χ values for each filter, using the same color-code as the top panel. The total χ2 value is given at the bottom left of the bottom panels.
Current usage metrics show cumulative count of Article Views (full-text article views including HTML views, PDF and ePub downloads, according to the available data) and Abstracts Views on Vision4Press platform.
Data correspond to usage on the plateform after 2015. The current usage metrics is available 48-96 hours after online publication and is updated daily on week days.
Initial download of the metrics may take a while.