Fig. 9.
Download original image
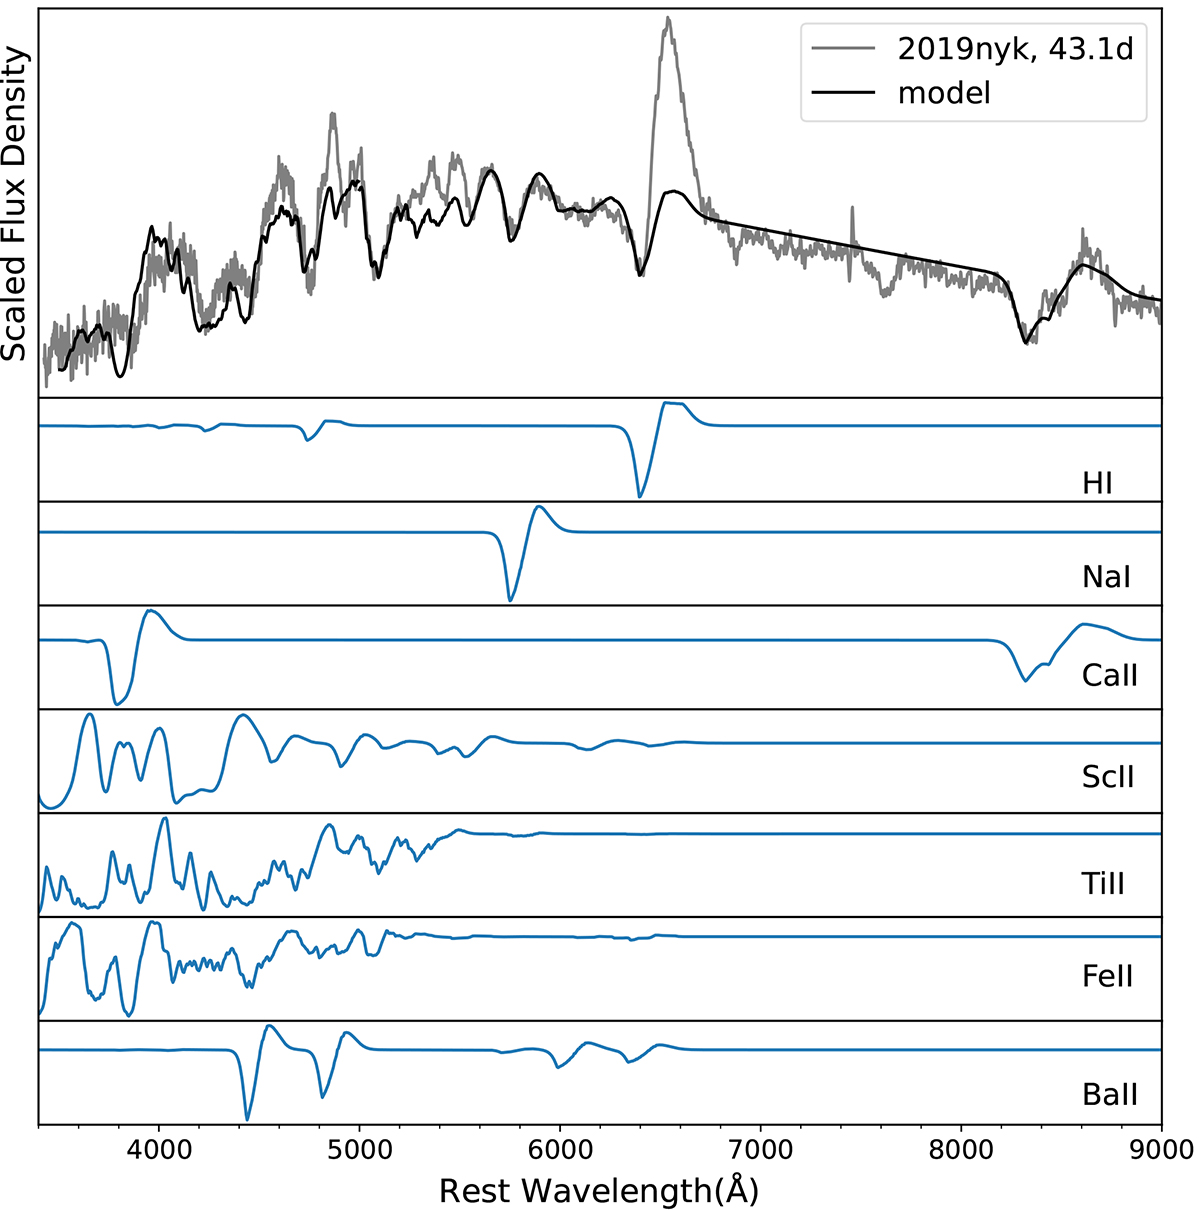
SYNAPPS model for the 43.1 d spectrum of SN 2019nyk is shown in the top panel along with the observed spectrum. The seven bottom panels depict the specific contributions of each of the seven ions in the top panel’s synthetic spectrum. The models in the bottom panels are generated using SYN++ by independently activating each of the seven ions.
Current usage metrics show cumulative count of Article Views (full-text article views including HTML views, PDF and ePub downloads, according to the available data) and Abstracts Views on Vision4Press platform.
Data correspond to usage on the plateform after 2015. The current usage metrics is available 48-96 hours after online publication and is updated daily on week days.
Initial download of the metrics may take a while.