Open Access
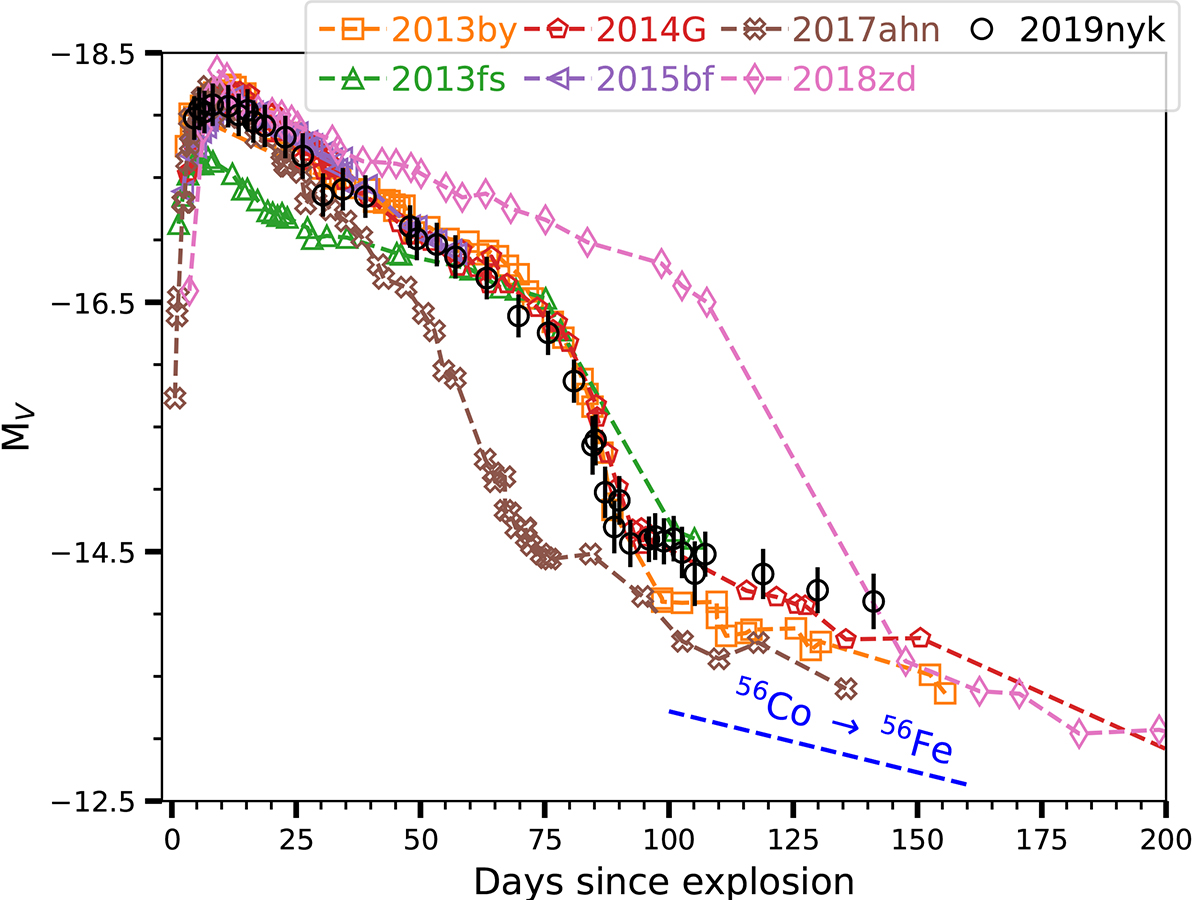
Fig. 5.
Download original image
Comparison of absolute V band LCs of SN 2019nyk with those of the comparison sample. The magnitudes are corrected for distance and reddening as listed in Table 5. The radioactive decay line assuming full trapping of photons is shown with a dashed line.
Current usage metrics show cumulative count of Article Views (full-text article views including HTML views, PDF and ePub downloads, according to the available data) and Abstracts Views on Vision4Press platform.
Data correspond to usage on the plateform after 2015. The current usage metrics is available 48-96 hours after online publication and is updated daily on week days.
Initial download of the metrics may take a while.