Fig. 23.
Download original image
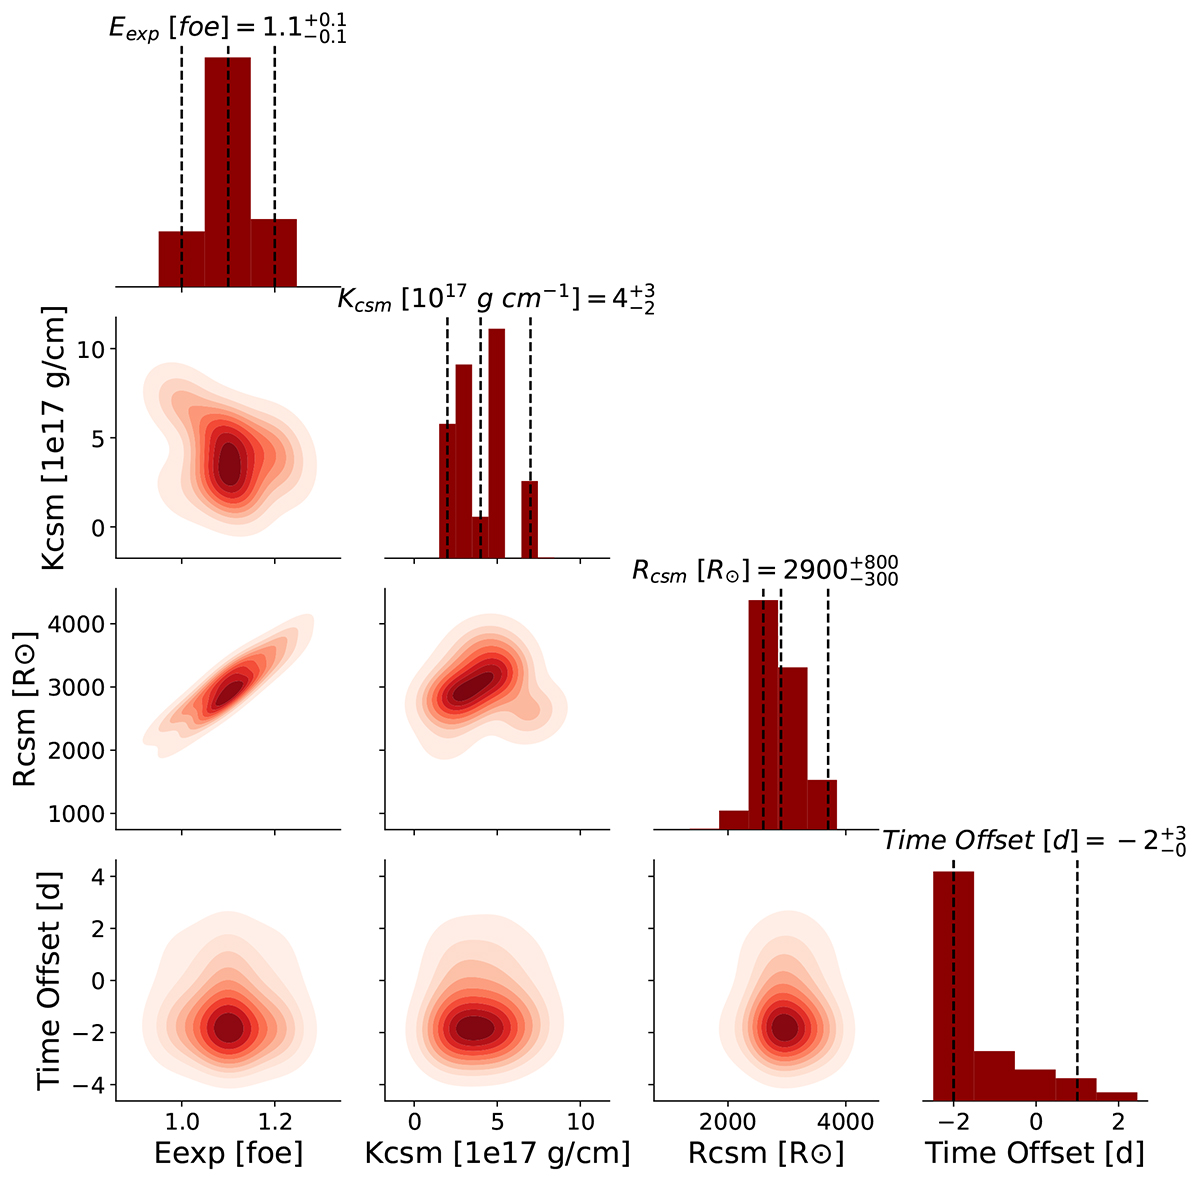
Corner plot displaying 1D and 2D posterior distributions for parameter uncertainty estimation. The diagonal sub-plots show 1D histograms of the posterior distribution of the explosion energy (Eexp), the mass loading parameter (Kcsm), the CSM radial extent (Rcsm) and the time offset. The 5th, 50th, and 95th percentiles for each of the parameters are shown with vertical dashed lines. The off-axis sub-plots show 9 contour levels for 2D joint probability densities at various confidence intervals, ranging from 10% to 90%.
Current usage metrics show cumulative count of Article Views (full-text article views including HTML views, PDF and ePub downloads, according to the available data) and Abstracts Views on Vision4Press platform.
Data correspond to usage on the plateform after 2015. The current usage metrics is available 48-96 hours after online publication and is updated daily on week days.
Initial download of the metrics may take a while.