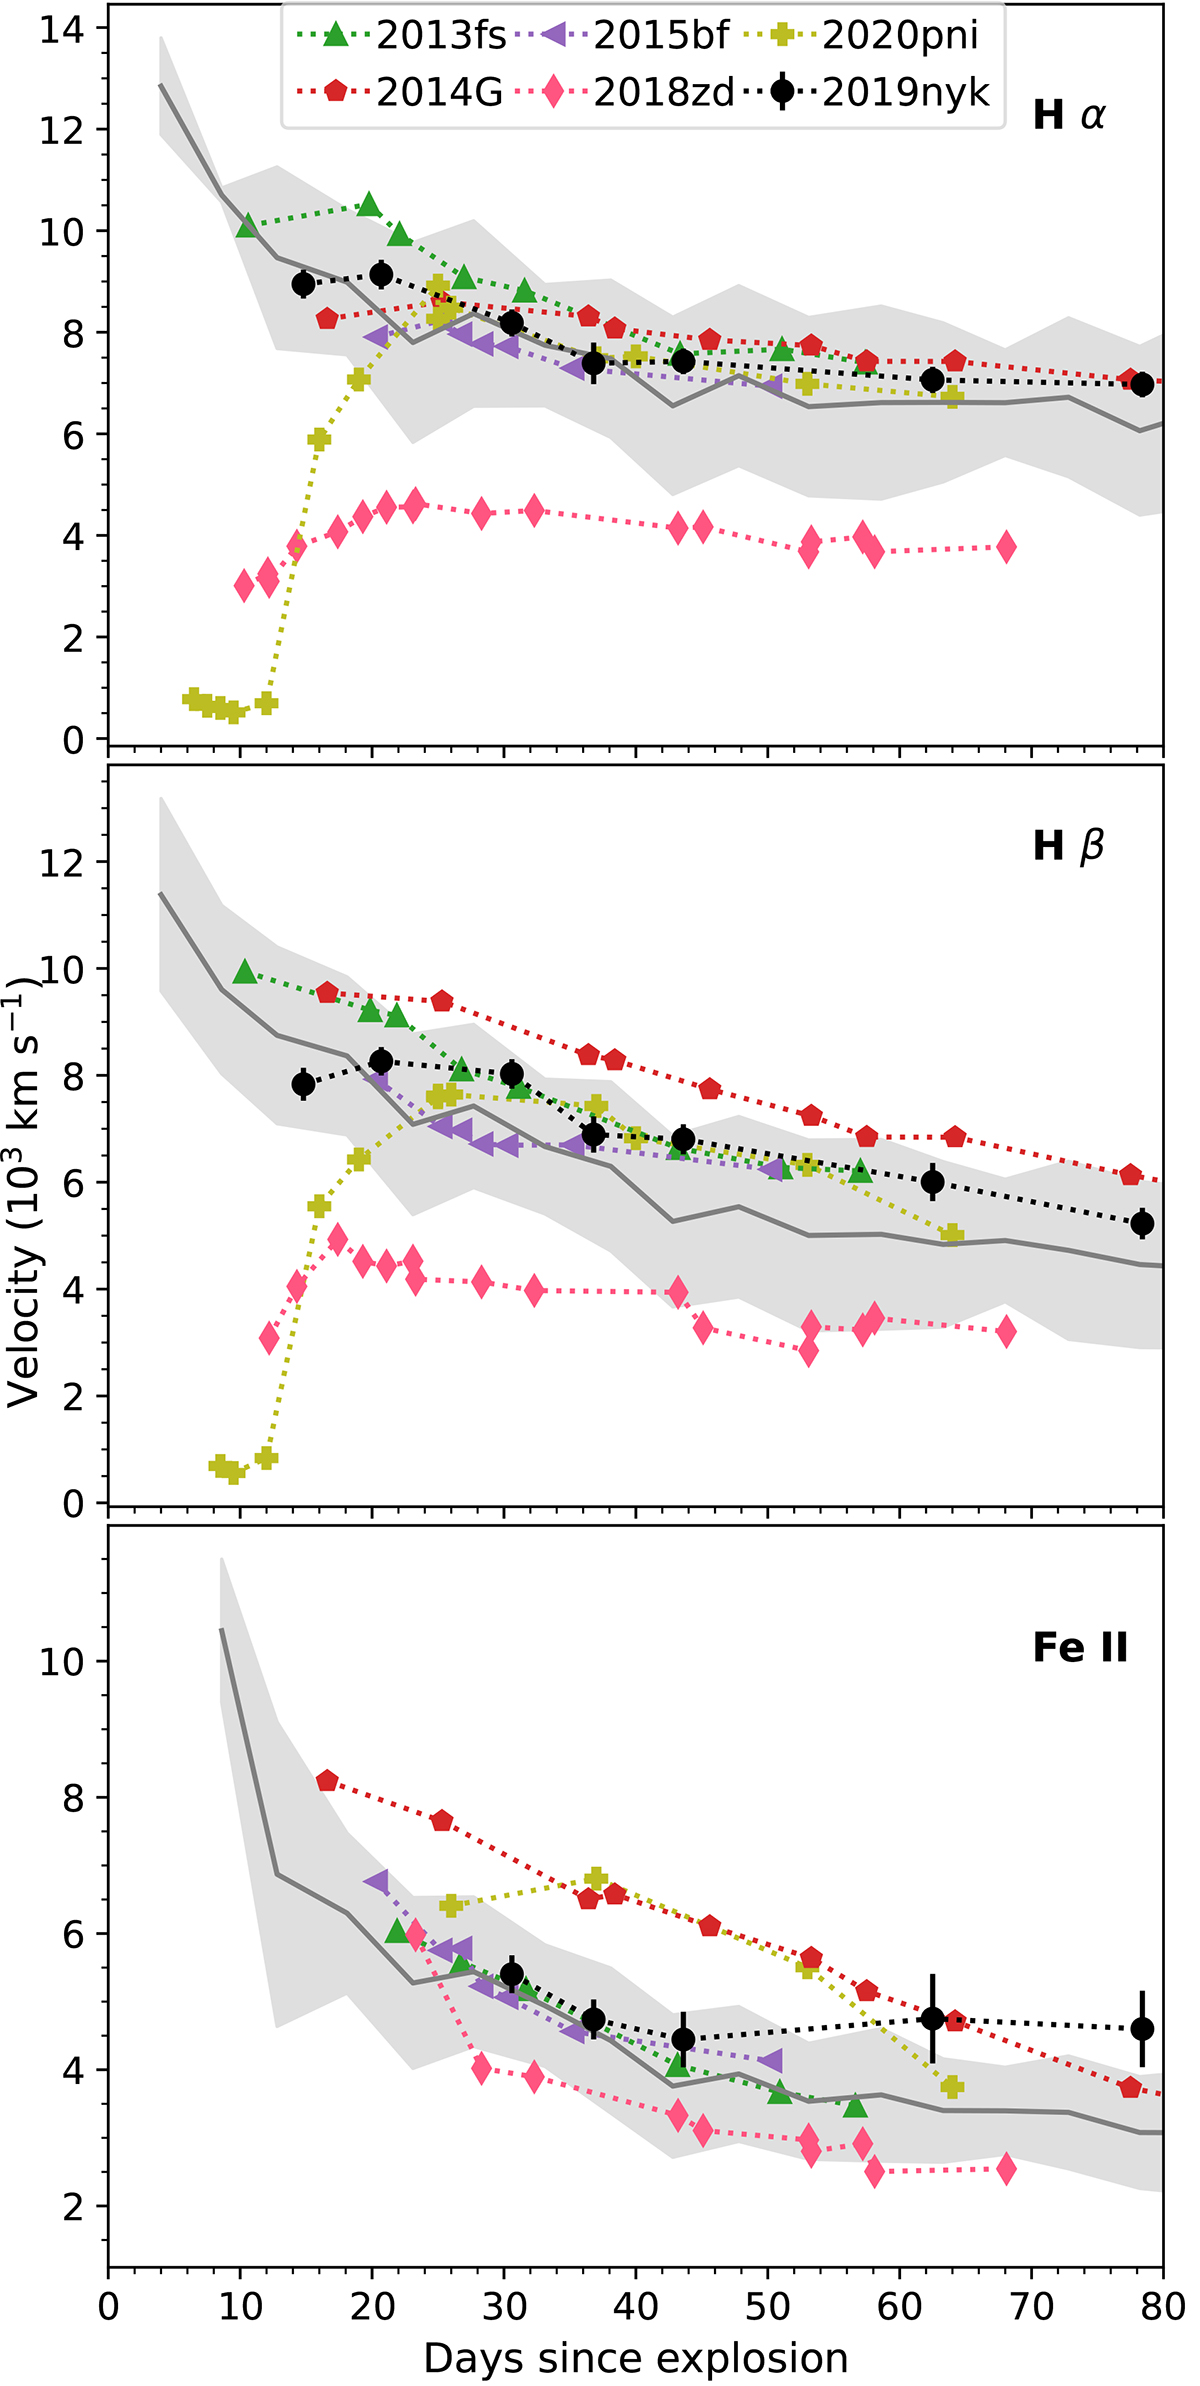
Fig. 14.
Download original image
Expansion velocity of SN 2019nyk is shown along with that of the comparison sample SNe and the mean velocity (grey) of 122 IIP/IIL SNe (Gutiérrez et al. 2017) for H[[INLINE611]] (top panel), H[[INLINE612]] (middle panel), and Fe II (λ5169; bottom panel). The light grey regions represent the standard deviations of the mean velocities of the sample.
Current usage metrics show cumulative count of Article Views (full-text article views including HTML views, PDF and ePub downloads, according to the available data) and Abstracts Views on Vision4Press platform.
Data correspond to usage on the plateform after 2015. The current usage metrics is available 48-96 hours after online publication and is updated daily on week days.
Initial download of the metrics may take a while.