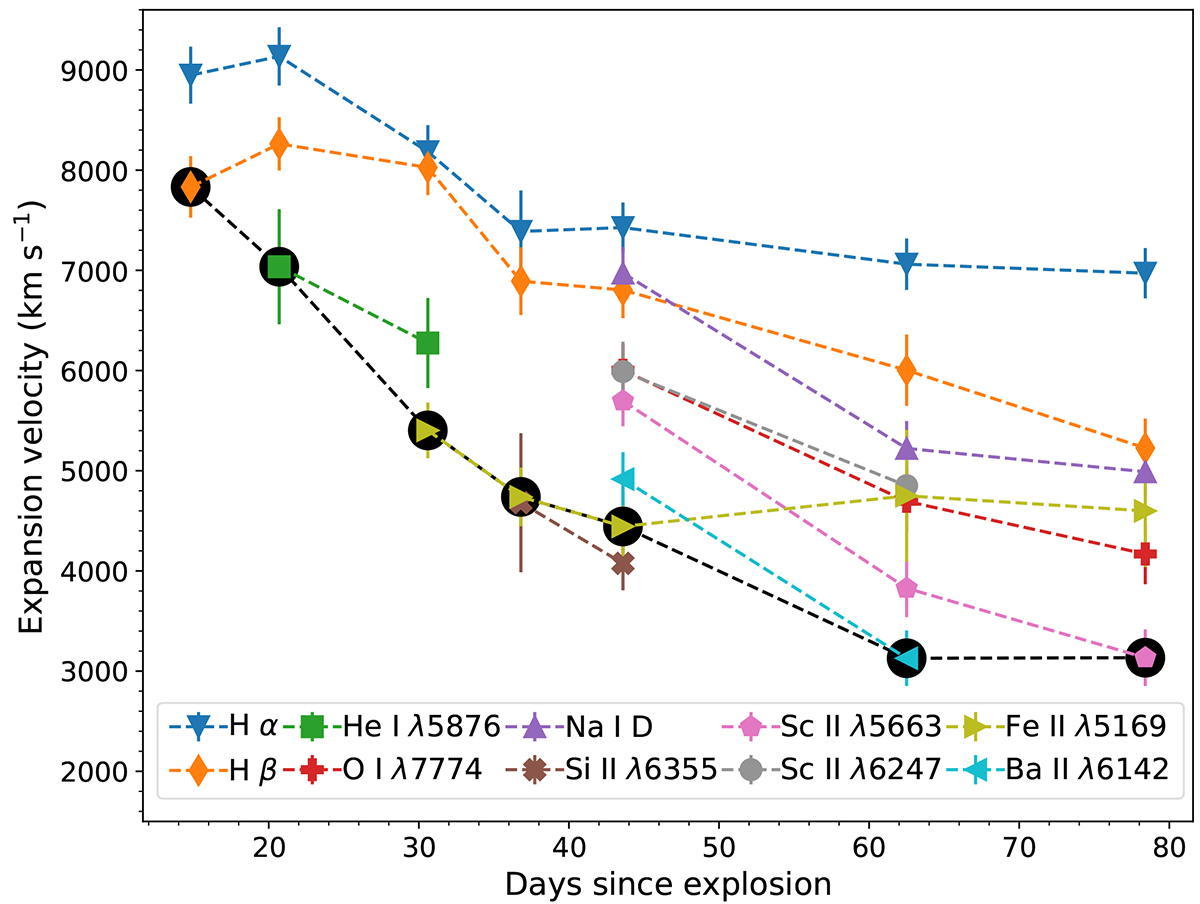
Fig. 10.
Download original image
Velocity evolution of the prominent lines in the spectra of SN 2019nyk, where the velocities were estimated from the minima of the absorption profiles. The black dashed line depicts the adopted photospheric velocity evolution for SN 2019nyk and used in Sect. 6, which corresponds to the velocity of the element with the lowest velocity at each epoch.
Current usage metrics show cumulative count of Article Views (full-text article views including HTML views, PDF and ePub downloads, according to the available data) and Abstracts Views on Vision4Press platform.
Data correspond to usage on the plateform after 2015. The current usage metrics is available 48-96 hours after online publication and is updated daily on week days.
Initial download of the metrics may take a while.