Fig. 7
Download original image
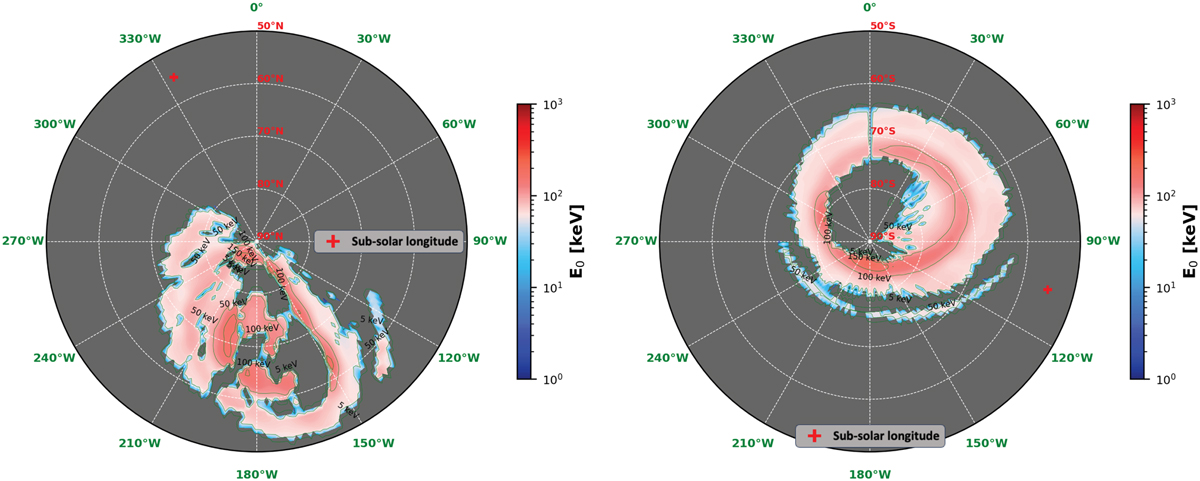
Characteristic energy maps E0 obtained from the CR(E0, θ) relationships (see Figs. D.2 and D.3) modeled for the case of an initial mono-energetic electron flux distribution, and from the CR observed during PJ32, at the north (left panel) and south (right panel) poles. Iso-energy lines are defined for values of 1, 5, 10 keV, in steps of 20 keV between 10 and 300 keV, and then in steps of 100 keV between 300 and 900 keV.
Current usage metrics show cumulative count of Article Views (full-text article views including HTML views, PDF and ePub downloads, according to the available data) and Abstracts Views on Vision4Press platform.
Data correspond to usage on the plateform after 2015. The current usage metrics is available 48-96 hours after online publication and is updated daily on week days.
Initial download of the metrics may take a while.