Fig. 2
Download original image
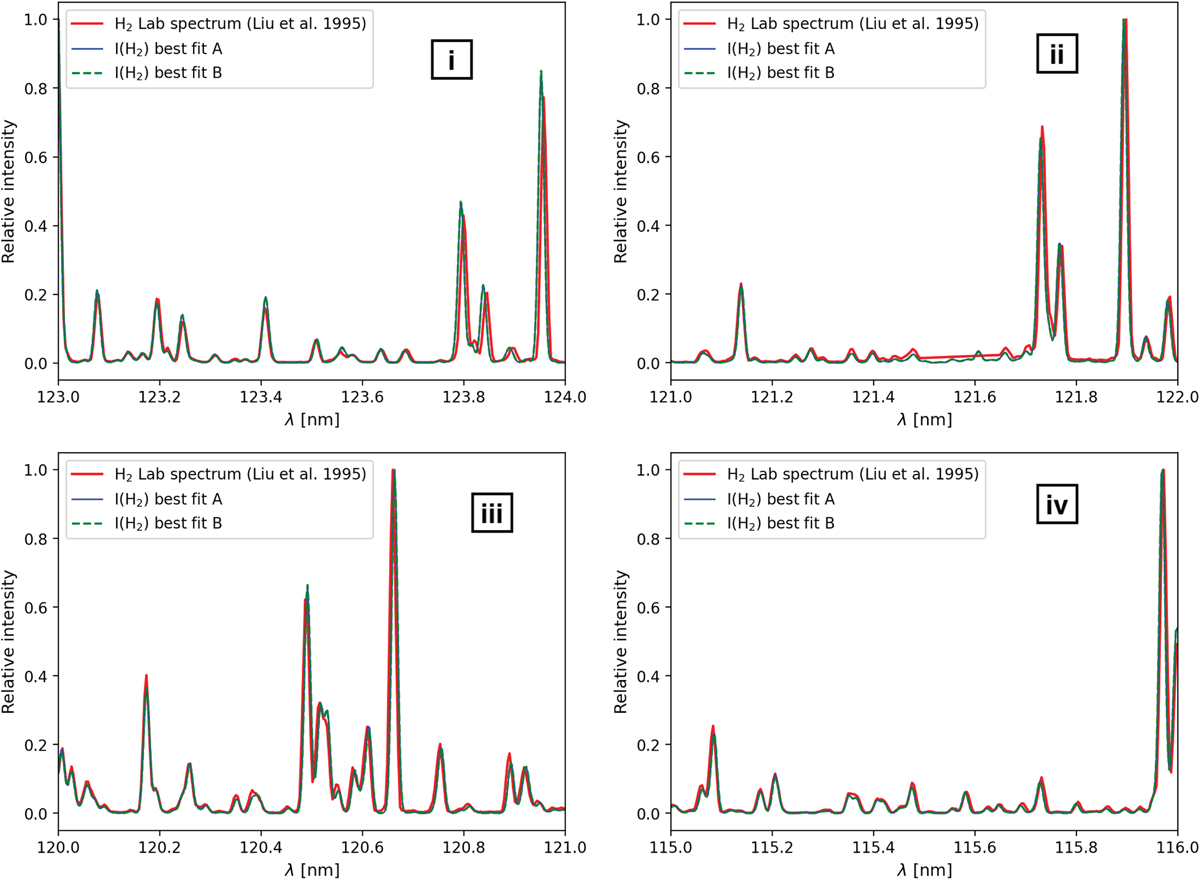
Examples of comparisons of modeled synthetic spectra with experimental spectra (red line) obtained by Liu et al. (1995) with a spectral resolution of 0.0125 nm. The blue line and the dashed green line represent the best fits obtained by precipitating a 100 eV mono-energetic (best fit A) and Maxwellian (best fit B) electron flux distributions. The four spectral windows shown have a width of 1 nm. In the ii window around 121.567 nm, the Lyman-α line was filtered out.
Current usage metrics show cumulative count of Article Views (full-text article views including HTML views, PDF and ePub downloads, according to the available data) and Abstracts Views on Vision4Press platform.
Data correspond to usage on the plateform after 2015. The current usage metrics is available 48-96 hours after online publication and is updated daily on week days.
Initial download of the metrics may take a while.