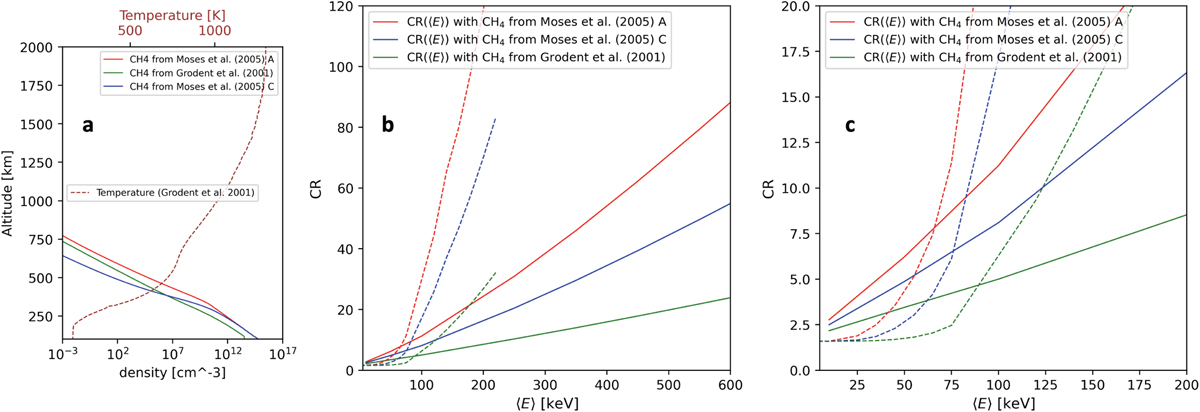
Fig. D.4
Download original image
Model of the CR(〈E〉), θ) relationship for θ = 0° using different CH4 abundance profiles. In panel a, the red, blue, and green solid lines represent the CH4 abundance profile from, respectively, the A and C eddy diffusion models of Moses et al. (2005) and Hue et al. (2018), and the Grodent et al. (2001) atmospheric model. In panel b is represented the modeled CR(〈E〉) relationship. The solid lines represent the CR modeled using kappa electron flux distribution and the dotted lines by using a mono-energetic flux distribution. The color conventions are the same as described for panel a. In panel c a zoomed-in version of panel b is shown to distinguish between the various CR(〈E〉) results at low energy.
Current usage metrics show cumulative count of Article Views (full-text article views including HTML views, PDF and ePub downloads, according to the available data) and Abstracts Views on Vision4Press platform.
Data correspond to usage on the plateform after 2015. The current usage metrics is available 48-96 hours after online publication and is updated daily on week days.
Initial download of the metrics may take a while.