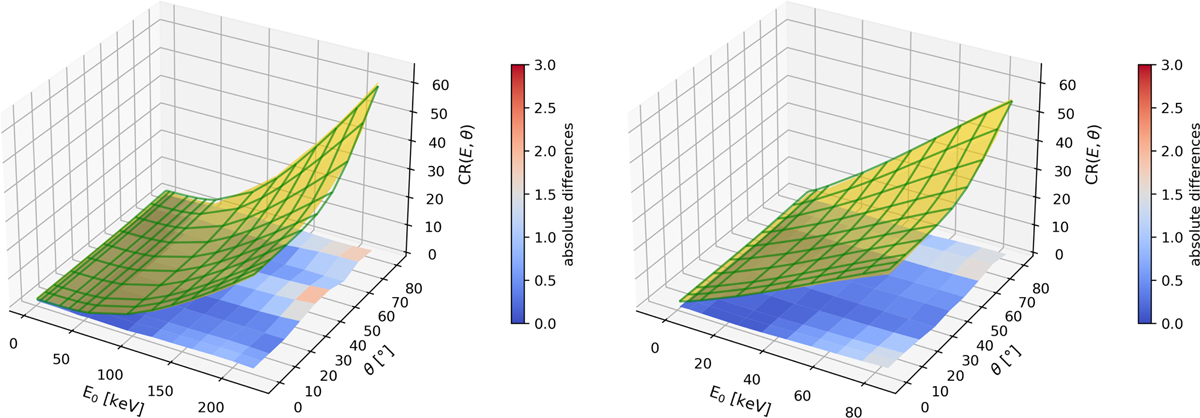
Fig. D.2
Download original image
3D representation of the CR(E0, θ) modeled relationship for the case of a mono-energetic distribution (left panel) and for the case of a kappa distribution (right panel). Both relationships are calculated for the north pole (i.e., for ψ = 65.7°). The green grid lines represent the fit of the modeled CR(E0, θ) relationship. The colored surface (color bar from blue to red) represents the absolute difference between the modeled surface and the fit surface, with an average CR uncertainty of around 0.6 for the case of the mono-energetic distribution and an uncertainty of around 0.5 for the case of the kappa distribution.
Current usage metrics show cumulative count of Article Views (full-text article views including HTML views, PDF and ePub downloads, according to the available data) and Abstracts Views on Vision4Press platform.
Data correspond to usage on the plateform after 2015. The current usage metrics is available 48-96 hours after online publication and is updated daily on week days.
Initial download of the metrics may take a while.