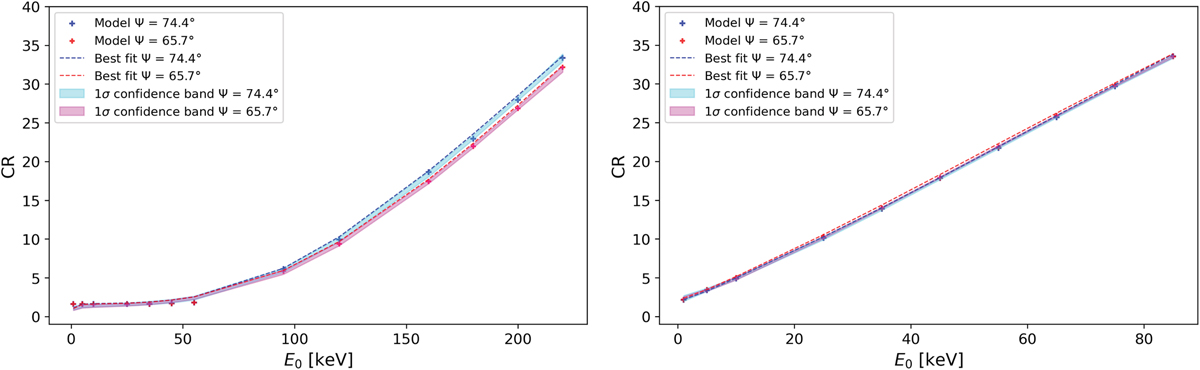
Fig. D.1
Download original image
Example of modeled CR(E0) relationship. In the left panel the modeled relationship CR(E0) corresponds to the case of a mono-energetic initial electron flux distribution. Similarly, in the right panel the relationship CR(E0) corresponds to the case of a kappa initial distribution as a function of caracteristic energy E0. The red and blue dots represent the modeled CR(E0) relationship, respectively, for the north pole with ψ = 65.7° and for the south pole with ψ = 74.4°. The dotted red and blue lines represent the best fit for the north pole and south pole, respectively, using equation D.1.
Current usage metrics show cumulative count of Article Views (full-text article views including HTML views, PDF and ePub downloads, according to the available data) and Abstracts Views on Vision4Press platform.
Data correspond to usage on the plateform after 2015. The current usage metrics is available 48-96 hours after online publication and is updated daily on week days.
Initial download of the metrics may take a while.