Fig. 8
Download original image
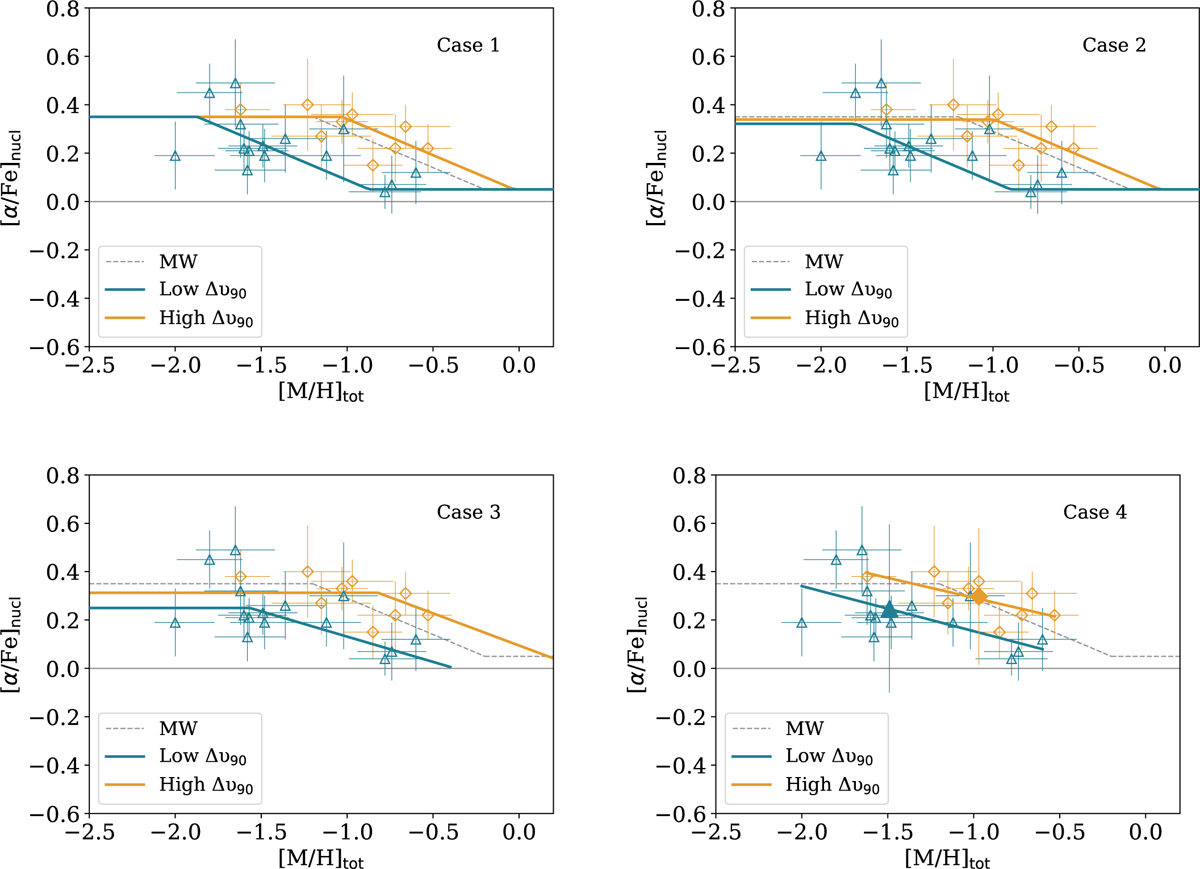
α-elements abundances for low-∆v90 (blue open triangles) and high ∆v90 (orange open diamonds) QSO-DLA systems. Case 1: data have been approximated by three-piecewise function: high-α plateau + decline + low-α plateau. The five parameters of the function are: levels of high- and low-α plateaus, and the slope and positions of the high- and low-α knees. During the fitting, only the position of the high-α knee is considered to be free, while the other parameters are fixed and set to values given for the MW. The gray dashed curve shows behaviour for the MW as determined by McWilliam (1997). Case 2: the level of the high-α plateau and position of the high-α knee are allowed to vary. Case 3: fitting the data with a two-piecewise function. Case 4: Fitting the data with a linear function. Two filled points at the lower right panel indicate median values in [M/H]tot and average values in [α/Fe]nucl show the systematic difference between the two subsamples. All the parameters and their uncertainties are shown in Table 2.
Current usage metrics show cumulative count of Article Views (full-text article views including HTML views, PDF and ePub downloads, according to the available data) and Abstracts Views on Vision4Press platform.
Data correspond to usage on the plateform after 2015. The current usage metrics is available 48-96 hours after online publication and is updated daily on week days.
Initial download of the metrics may take a while.