Fig. 2
Download original image
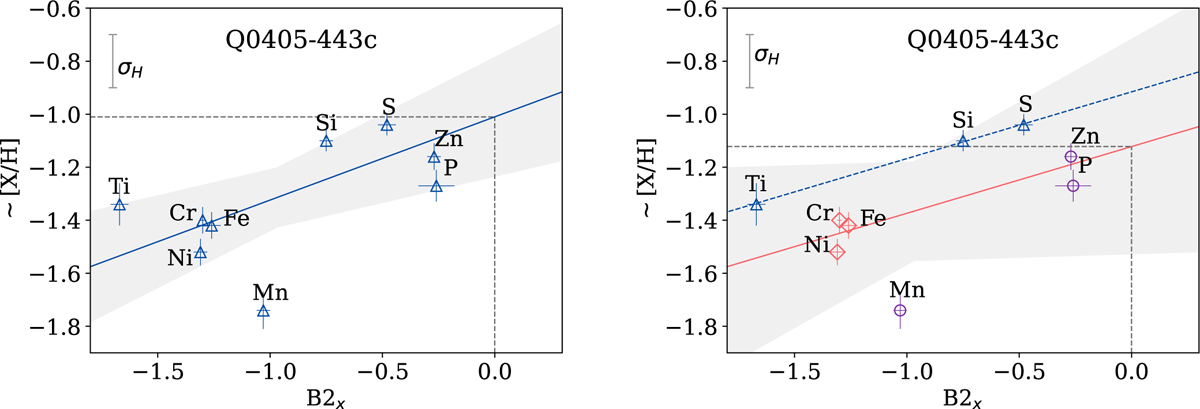
Linear fitting over the entire data set of [X/H] (left panel). The elements (right panel) are divided into three groups: α-elements (blue triangles), Fe-group elements (red diamonds), and other metals (purple circles). The blue dashed line shows linear fitting over solely the α-element abundances, the red solid line is the blue dashed line shifted to the value averaged over Fe-group elements. The gray filled areas show 3σ confidence intervals. The total metallicity [M/H]tot is shown by intersection of gray dashed lines.
Current usage metrics show cumulative count of Article Views (full-text article views including HTML views, PDF and ePub downloads, according to the available data) and Abstracts Views on Vision4Press platform.
Data correspond to usage on the plateform after 2015. The current usage metrics is available 48-96 hours after online publication and is updated daily on week days.
Initial download of the metrics may take a while.