Fig. C.1
Download original image
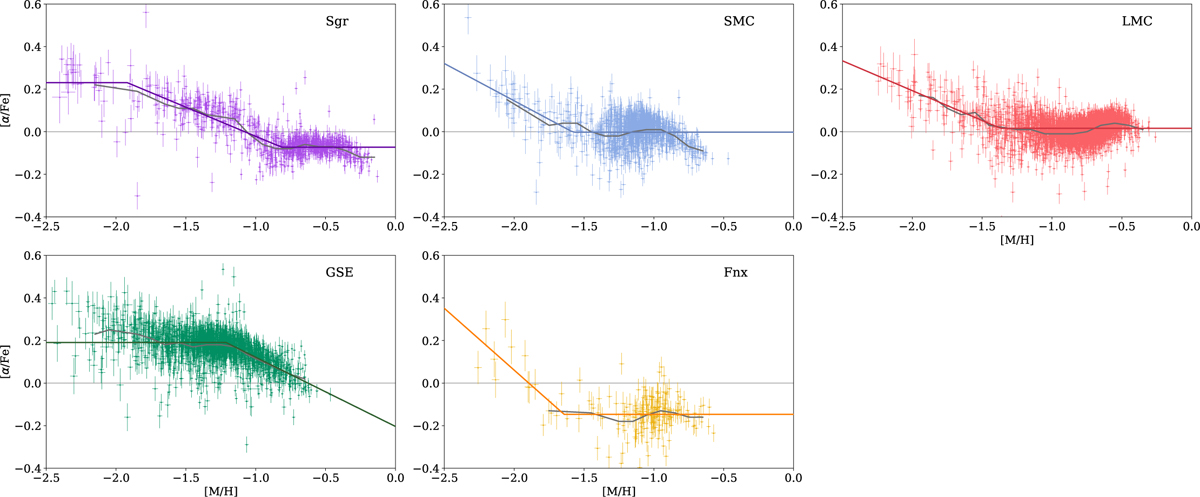
Chemical abundances of α-elements taken from the APOGEE DR17 catalog for dwarf galaxies (color points with x, y error bars), with Hasselquist et al. (2021) selection. Color solid curves show the approximation of the data points by piecewise functions consisting of two or three straight lines representing the average behaviour of α-elements relative to iron. Dark gray solid curves have been obtained by averaging the data in each metallicity bin. Typically, the bin width is equal to 0.1 dex, but in some ranges where there are too few stars, it is increased up to 0.2 dex. For comparison, the behaviour typical for the MW is shown by gray dashed curve (McWilliam (1997)).
Current usage metrics show cumulative count of Article Views (full-text article views including HTML views, PDF and ePub downloads, according to the available data) and Abstracts Views on Vision4Press platform.
Data correspond to usage on the plateform after 2015. The current usage metrics is available 48-96 hours after online publication and is updated daily on week days.
Initial download of the metrics may take a while.