Fig. A.1
Download original image
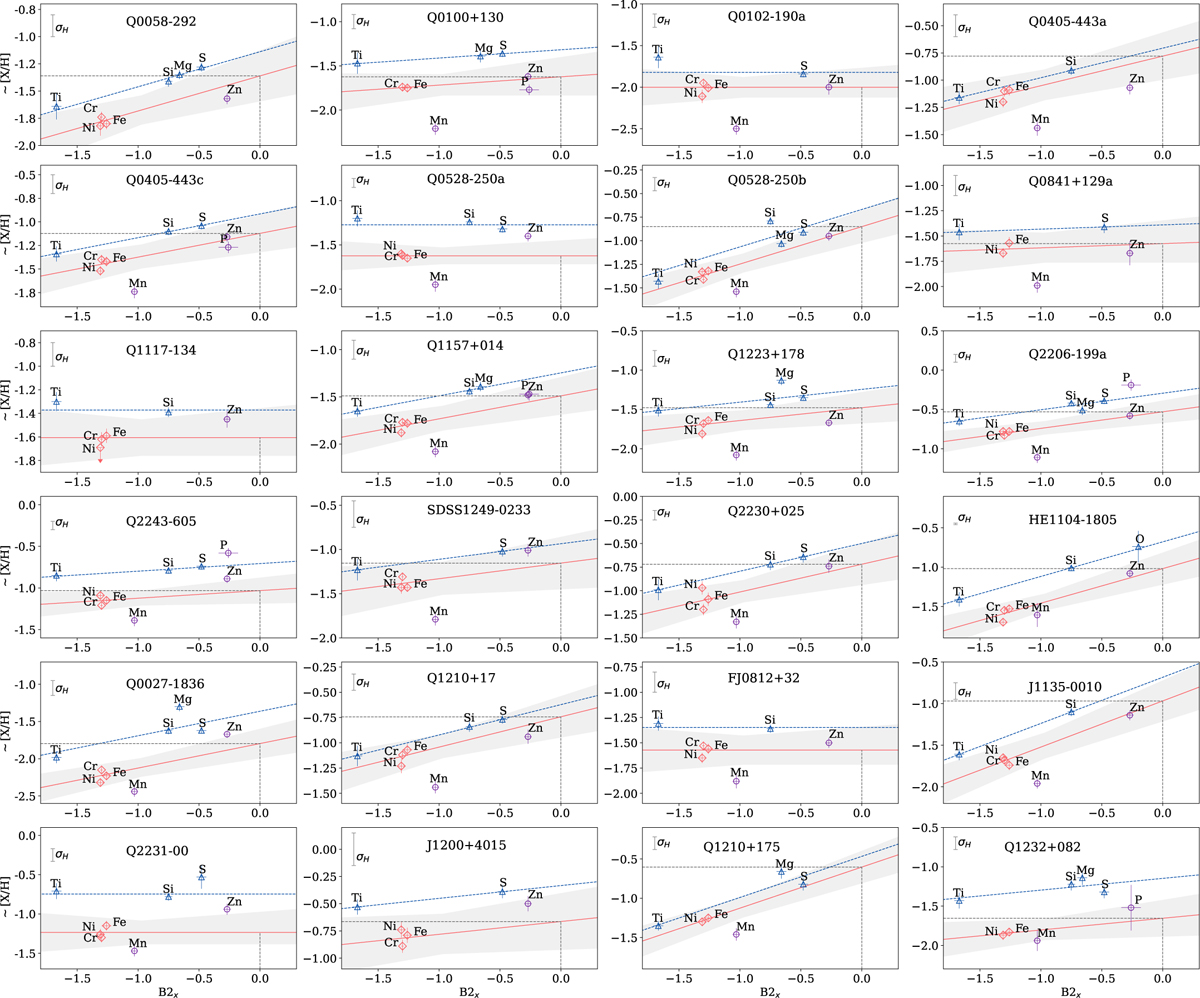
Abundance patterns for the golden sample of QSO-DLA (see Sec. 3). Blue dashed curve is fitting to the α-elements, shown by blue open triangles. Red curve is shifted blue one to the value averaged through Ni, Cr, and Fe. The intersection of the gray dashed lines at B2X = 0 shows the metallicity [M/H]tot of each system. Gray areas show 1σ confidence intervals.
Current usage metrics show cumulative count of Article Views (full-text article views including HTML views, PDF and ePub downloads, according to the available data) and Abstracts Views on Vision4Press platform.
Data correspond to usage on the plateform after 2015. The current usage metrics is available 48-96 hours after online publication and is updated daily on week days.
Initial download of the metrics may take a while.