Fig. 11
Download original image
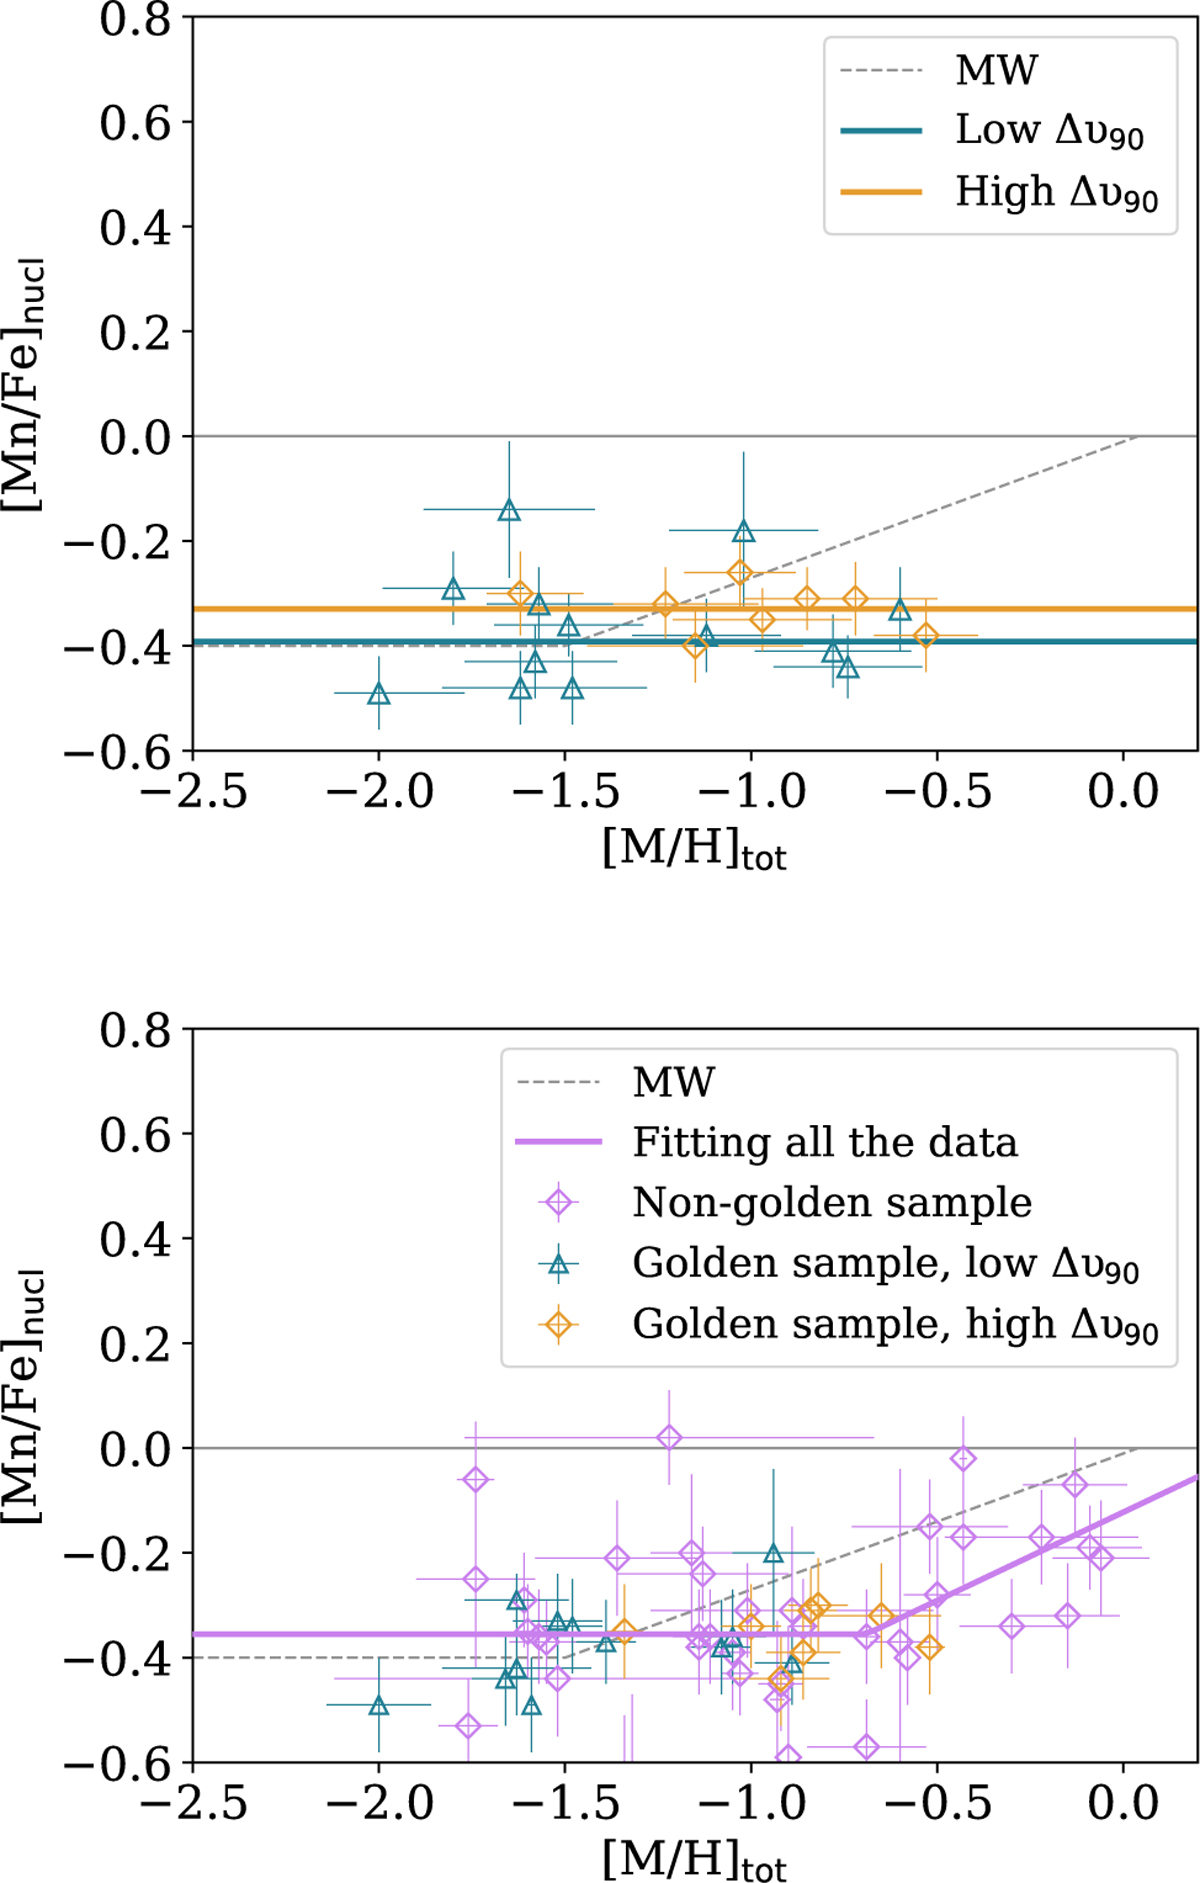
Manganese abundances in the ISM of DLAs. Upper panel: Mn abundances for the golden sample for Iow-∆v90 (blue open triangles) and high-∆v90 (orange open diamonds). Horizontal color lines show the weighted average values of –0.39 ± 0.10 and –0.33 ± 0.04 for the low-and high- ∆v90 subsamples, respectively. Lower panel: Mn abundances for the non-golden sample (magenta open diamonds) as well as for the golden sample (symbols as on the upper panel) with [Mn/Fe]nucl and [M/H]tot being derived according to the methodology used for the non-golden sample. Two points are out of the range of the figure at ([M/H]tot, [Mn/Fe]) = (–1.32 ± 0.22, –0.63 ± 0.16), and (–1.34 ± 0.08, –0.66 ± 0.15). In both panels, the gray dashed curve shows typical behaviour for the MW taken from Mishenina et al. (2015).
Current usage metrics show cumulative count of Article Views (full-text article views including HTML views, PDF and ePub downloads, according to the available data) and Abstracts Views on Vision4Press platform.
Data correspond to usage on the plateform after 2015. The current usage metrics is available 48-96 hours after online publication and is updated daily on week days.
Initial download of the metrics may take a while.