Open Access
Fig. A.2.
Download original image
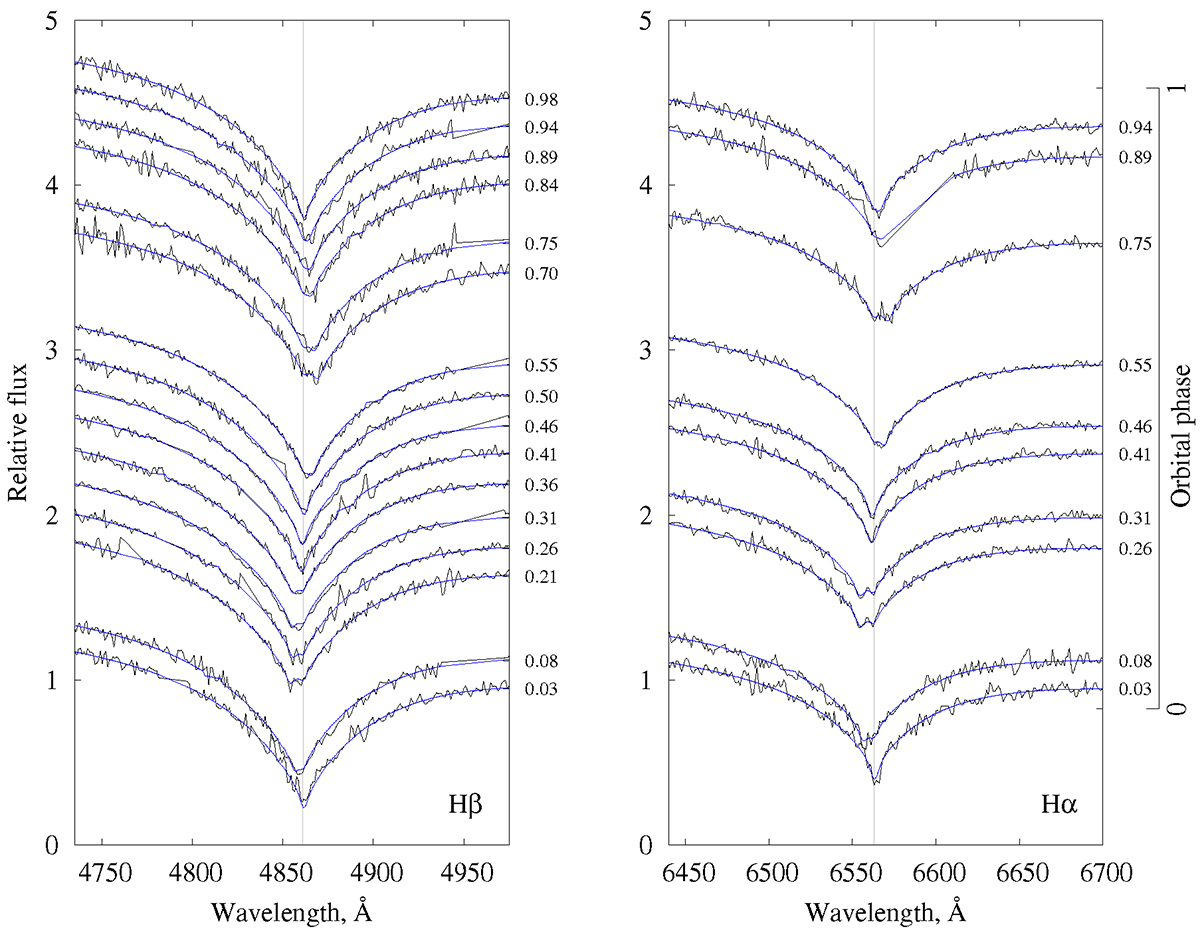
Best-fit XTGRID with WD models and the spectral evolution of the composite Hα (right panel) and Hβ (left panel) composite line profiles in the Gemini/GMOS observations in the rest frame of the primary. The fluxes of the observations were adjusted to the flux level of the theoretical composite continuum.
Current usage metrics show cumulative count of Article Views (full-text article views including HTML views, PDF and ePub downloads, according to the available data) and Abstracts Views on Vision4Press platform.
Data correspond to usage on the plateform after 2015. The current usage metrics is available 48-96 hours after online publication and is updated daily on week days.
Initial download of the metrics may take a while.