Fig. 9.
Download original image
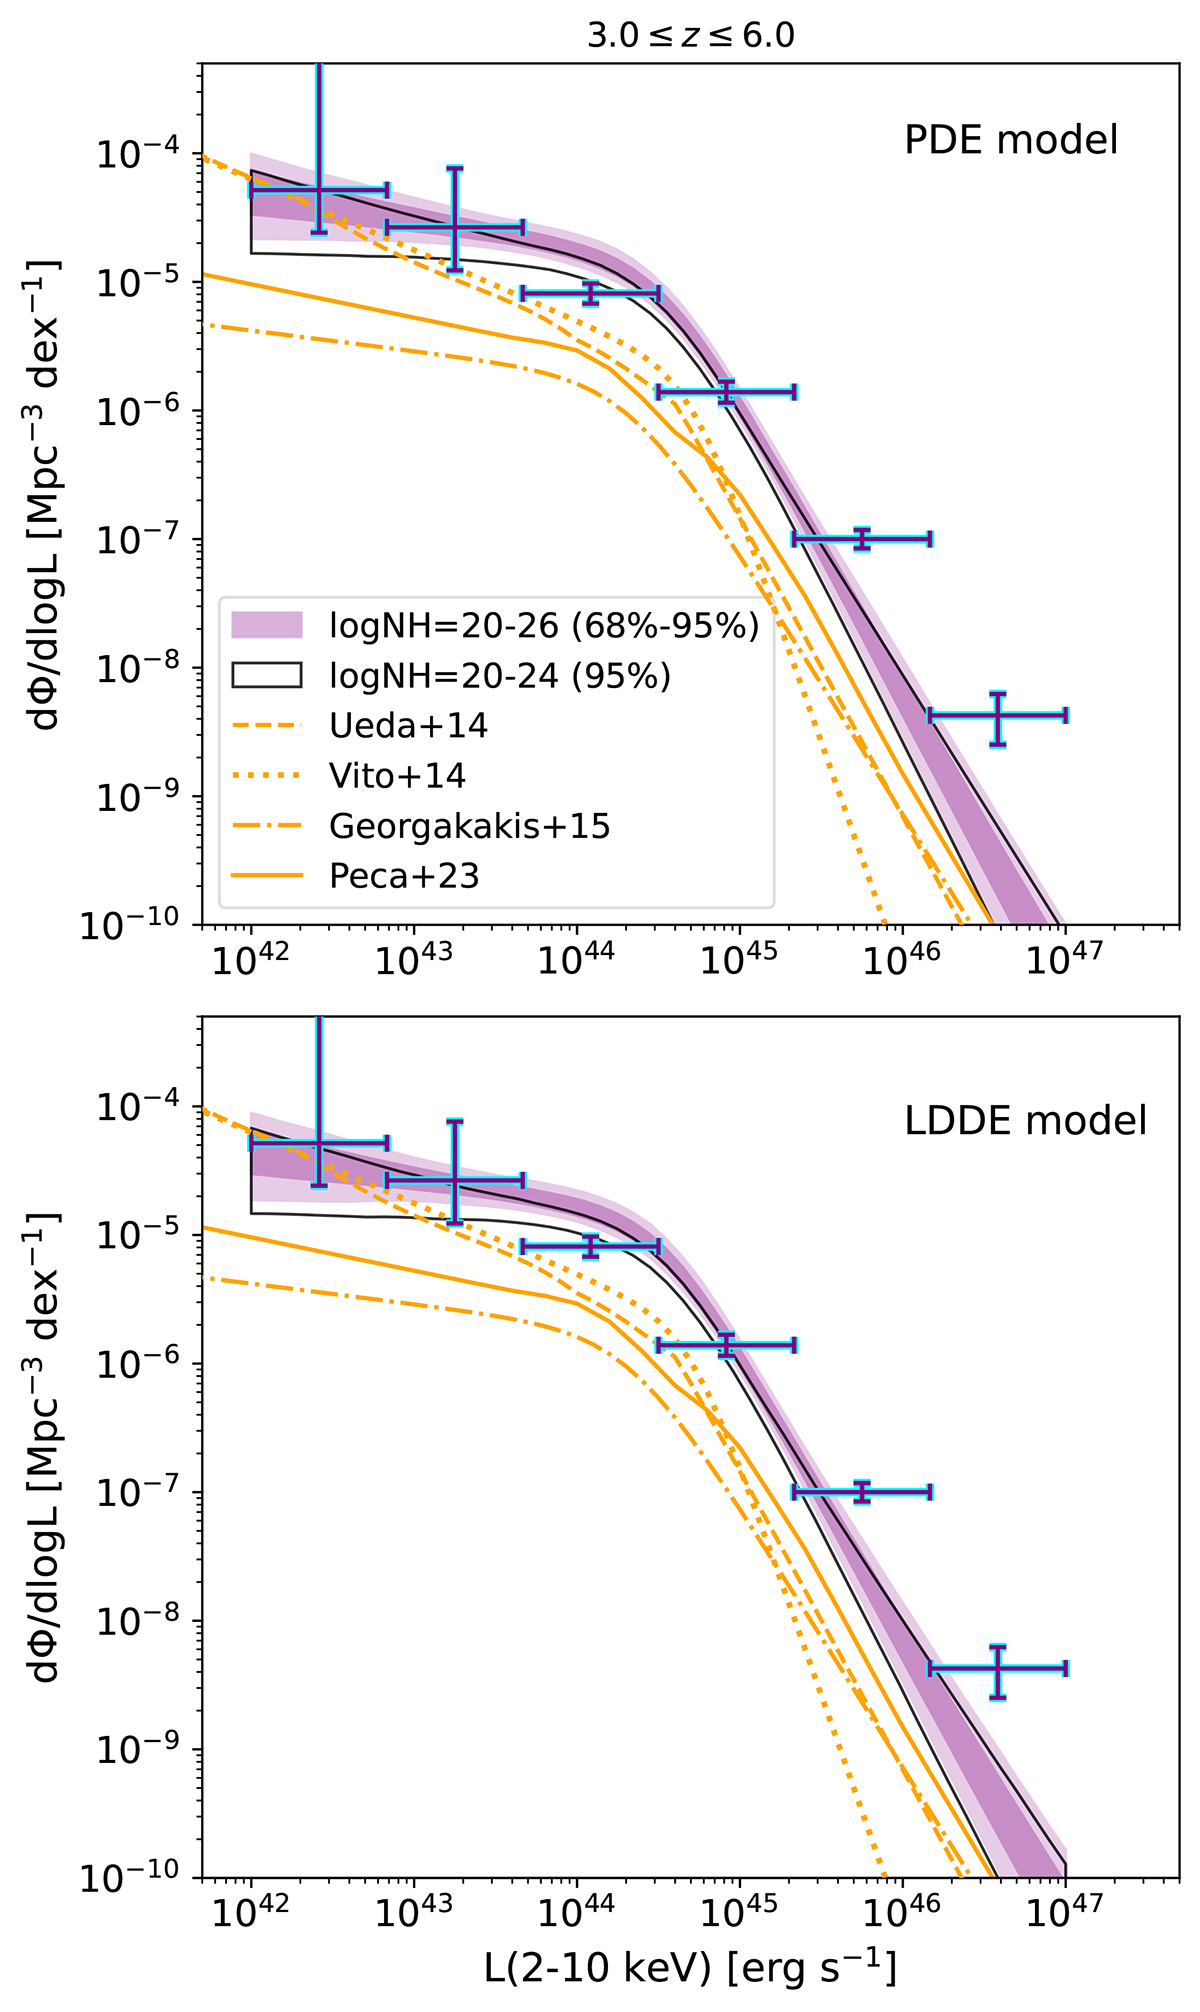
X-ray luminosity function in the redshift range 3.0 ≤ z ≤ 6.0 for the PDE (top) and LDDE model (bottom). The shaded regions represent the 68% and 95% confidence intervals of the XLF when integrating over 20 ≤ log NH ≤ 26, while the black lines show the XLF when integrating over 20 ≤ log NH ≤ 24. The points show the binned luminosity function. For comparison, shown are the XLFs derived by previous X-ray studies in the column density range log NH = 20 − 24. The best-fitting models of these studies are evaluated at the mean redshift of each bin.
Current usage metrics show cumulative count of Article Views (full-text article views including HTML views, PDF and ePub downloads, according to the available data) and Abstracts Views on Vision4Press platform.
Data correspond to usage on the plateform after 2015. The current usage metrics is available 48-96 hours after online publication and is updated daily on week days.
Initial download of the metrics may take a while.