Fig. 8.
Download original image
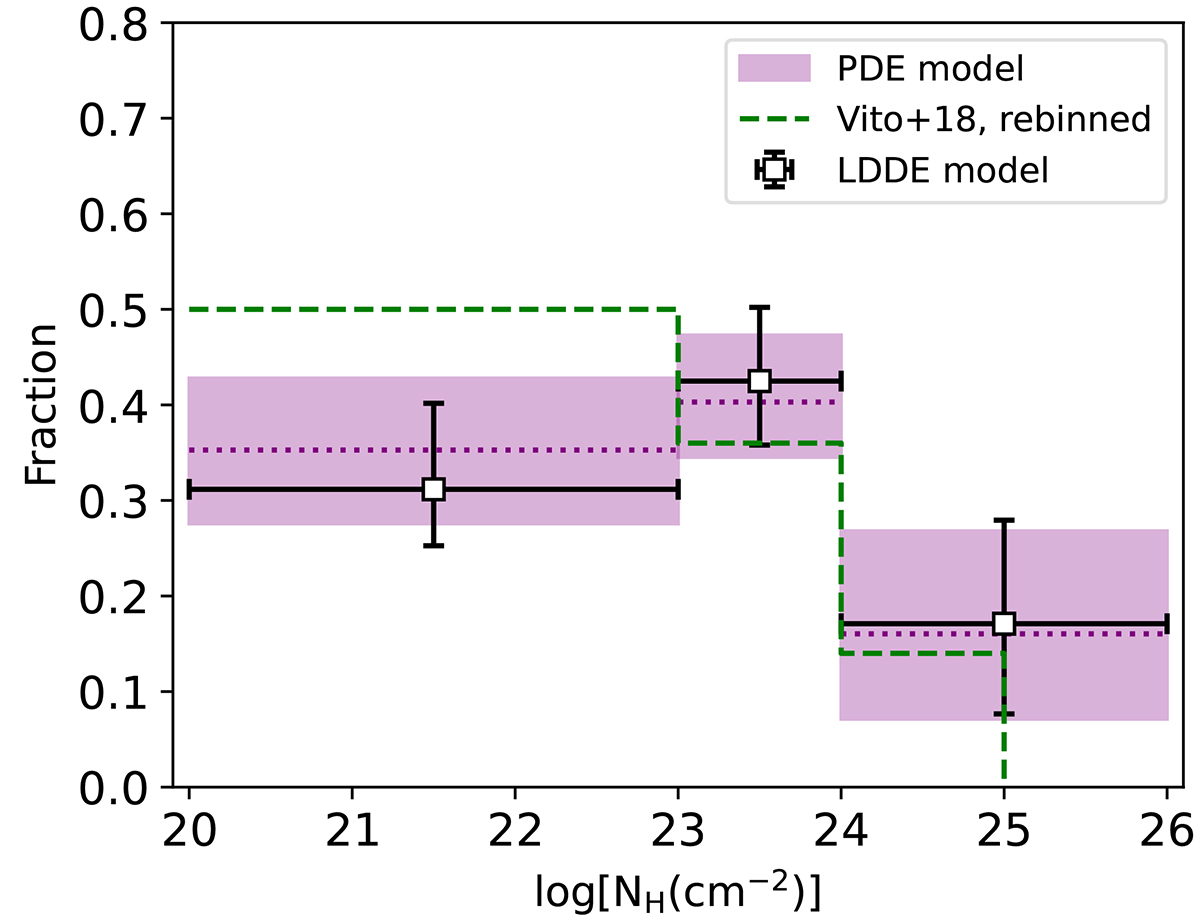
Best-fitting intrinsic absorption function in the redshift range 3 ≤ z ≤ 6 for the PDE model (dotted line). The boxes show the credible regions that correspond to 1σ confidence intervals of the posterior probabilities. The points represent the best-fitting results when using the LDDE model along with the 1σ uncertainties. For reference, shown are the results of Vito et al. (2018) re-scaled to the bins of our analysis (dashed line). The solid line presents their original absorption function; it is normalised between log NH = 20 − 25.
Current usage metrics show cumulative count of Article Views (full-text article views including HTML views, PDF and ePub downloads, according to the available data) and Abstracts Views on Vision4Press platform.
Data correspond to usage on the plateform after 2015. The current usage metrics is available 48-96 hours after online publication and is updated daily on week days.
Initial download of the metrics may take a while.