Fig. 4.
Download original image
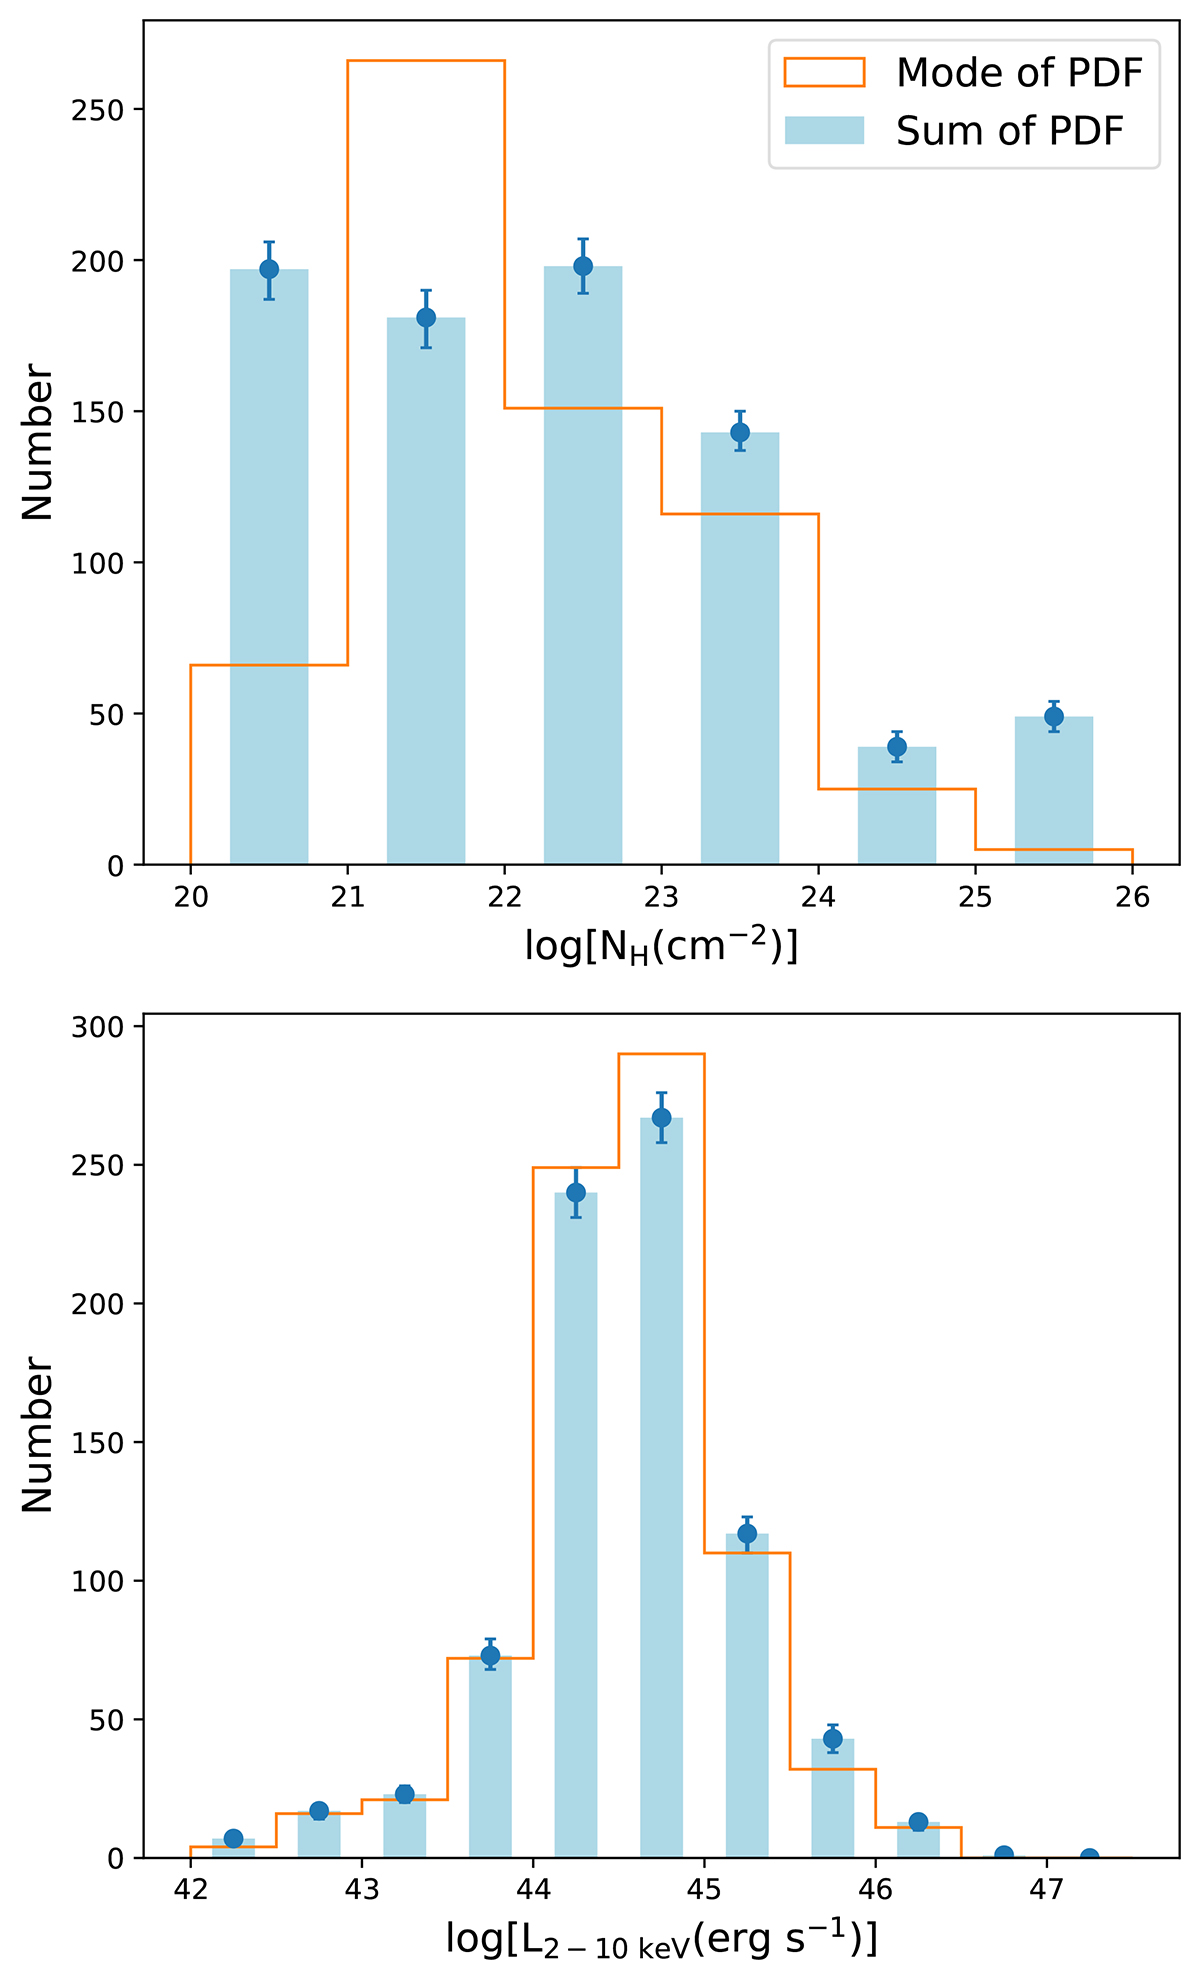
Distributions of the hydrogen column density (top panel) and the 2 − 10 keV absorption corrected luminosity (bottom panel) for the high-z sample. The blue bars correspond to the sum of the probability density functions, while the orange lines represent the histograms of the properties when taking into account only the nominal values (mode of the posterior probability distributions).
Current usage metrics show cumulative count of Article Views (full-text article views including HTML views, PDF and ePub downloads, according to the available data) and Abstracts Views on Vision4Press platform.
Data correspond to usage on the plateform after 2015. The current usage metrics is available 48-96 hours after online publication and is updated daily on week days.
Initial download of the metrics may take a while.