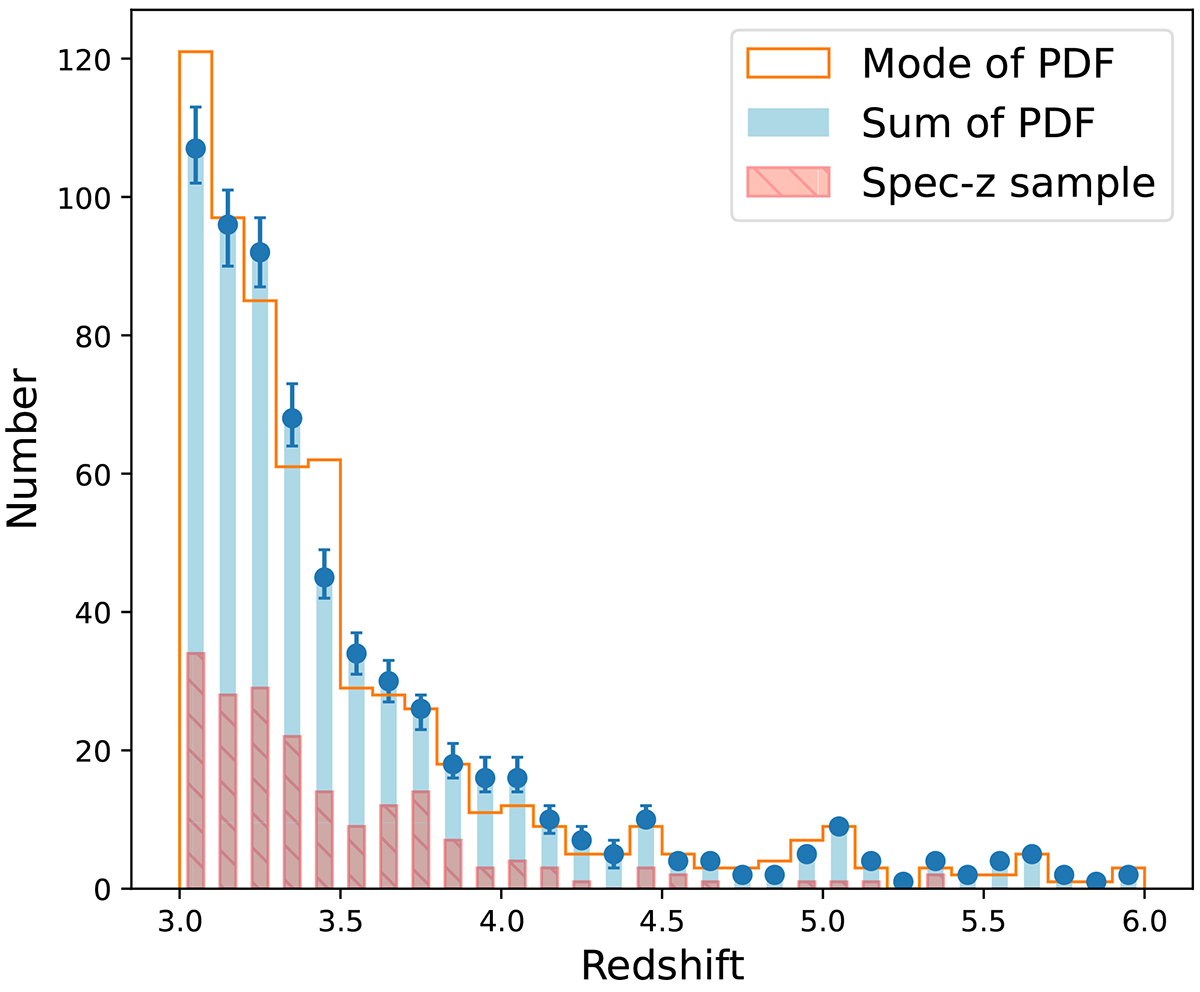
Fig. 2.
Download original image
Redshift distribution of our sample. The blue bars correspond to the sum of the PDF(z). The PDF(z) of sources with available spectroscopic redshift are represented by a Delta function centred at the spec-z value. The orange line represents the redshift histogram when taking into account only the mode of the PDF(z) for each source. The red hatched bars represent the spec-z sample.
Current usage metrics show cumulative count of Article Views (full-text article views including HTML views, PDF and ePub downloads, according to the available data) and Abstracts Views on Vision4Press platform.
Data correspond to usage on the plateform after 2015. The current usage metrics is available 48-96 hours after online publication and is updated daily on week days.
Initial download of the metrics may take a while.