Fig. B.2.
Download original image
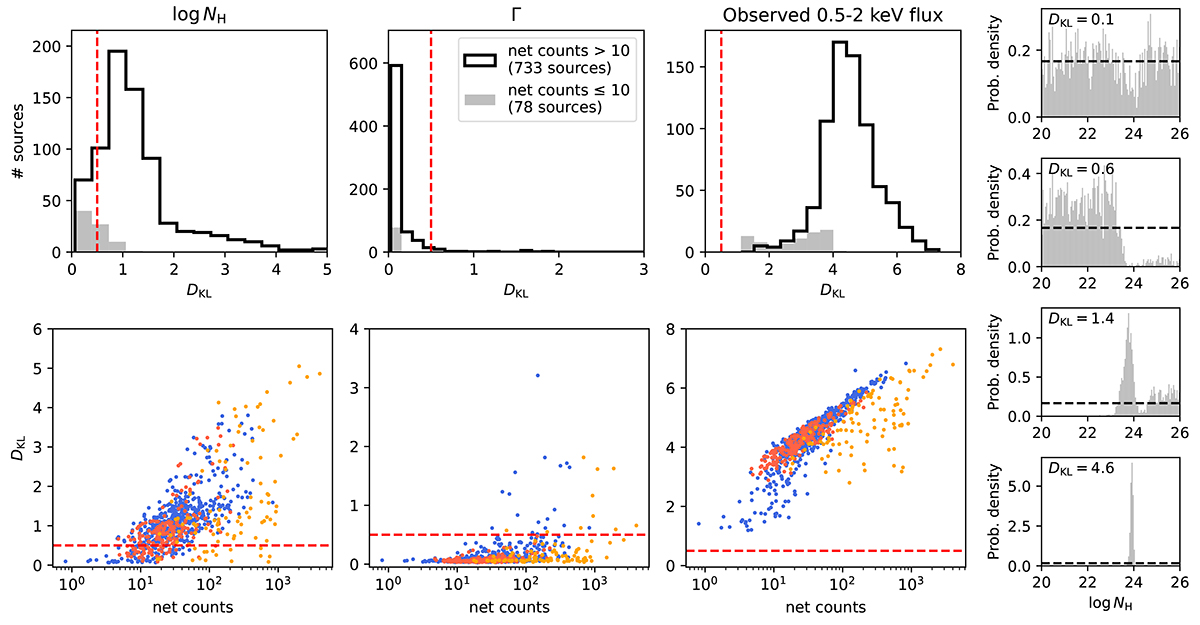
Informational gain obtained for our X-ray fitting results. Top row: Distribution of the Kullback-Leibler divergence for hydrogen column density, photon index, and observed X-ray flux. The solid black lines show the distribution for sources with more than ten net counts in their X-ray spectra; the grey shaded areas show the distribution for sources with fewer than ten net counts. The vertical dashed red lines show DKL = 0.5. Bottom row:DKL vs net counts for the same three parameters in the top row. The symbols are colour-coded according to the source survey (blue: XXL-North; red: CCLS; orange: CDF). The horizontal dashed red lines again show DKL = 0.5. Right column: Four examples of the log NH posterior distribution (grey histograms) obtained from our X-ray spectral fits, for different DKL values. The horizontal dashed lines show the flat prior distribution assumed in our analysis.
Current usage metrics show cumulative count of Article Views (full-text article views including HTML views, PDF and ePub downloads, according to the available data) and Abstracts Views on Vision4Press platform.
Data correspond to usage on the plateform after 2015. The current usage metrics is available 48-96 hours after online publication and is updated daily on week days.
Initial download of the metrics may take a while.