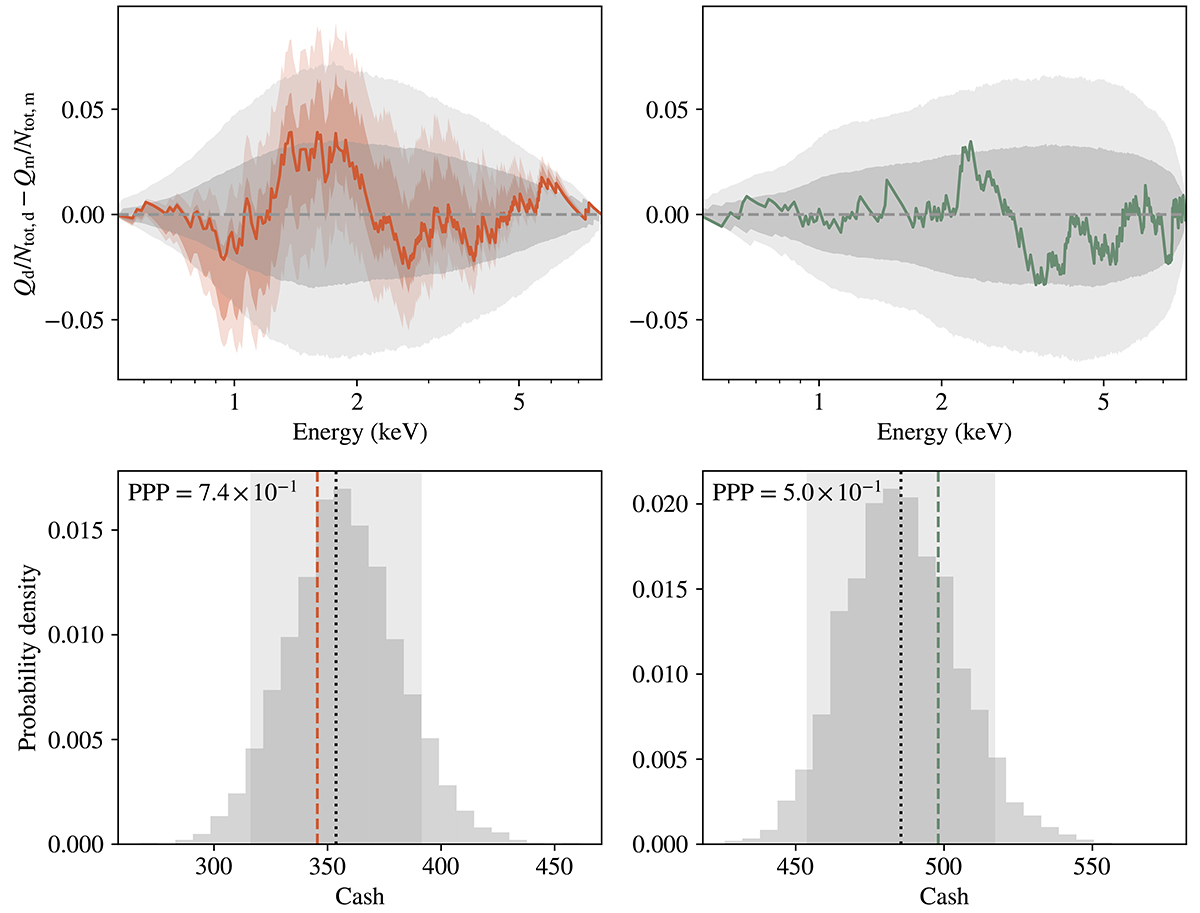
Fig. B.1.
Download original image
Example of posterior predictive checks for the Chandra source CCLS LID 460. The panels on the left show the results for the source data, while the right panels correspond to the background data. Top panels: Differential QQ-plots. The grey shaded areas show the one-sigma and two-sigma percentiles for 5000 X-ray spectral simulations using a random sampling of the posterior distribution. The solid lines correspond to the best-fit model obtained using BXA, and the red shaded areas are the one-sigma and two-sigma percentiles from the posterior distribution. Bottom panels: Grey histograms showing the distribution of the Cash statistic for the simulations. The vertical dashed lines show the Cash value for our best-fit model. The vertical dotted lines and the vertical shaded areas show, respectively, the expected Cash value (Ce) for the best-fit model and the corresponding 90% confidence region estimated using the Kaastra (2017) method. The values in the upper left corner of each panel are the posterior predictive p-values estimated using the simulations.
Current usage metrics show cumulative count of Article Views (full-text article views including HTML views, PDF and ePub downloads, according to the available data) and Abstracts Views on Vision4Press platform.
Data correspond to usage on the plateform after 2015. The current usage metrics is available 48-96 hours after online publication and is updated daily on week days.
Initial download of the metrics may take a while.