Fig. 15.
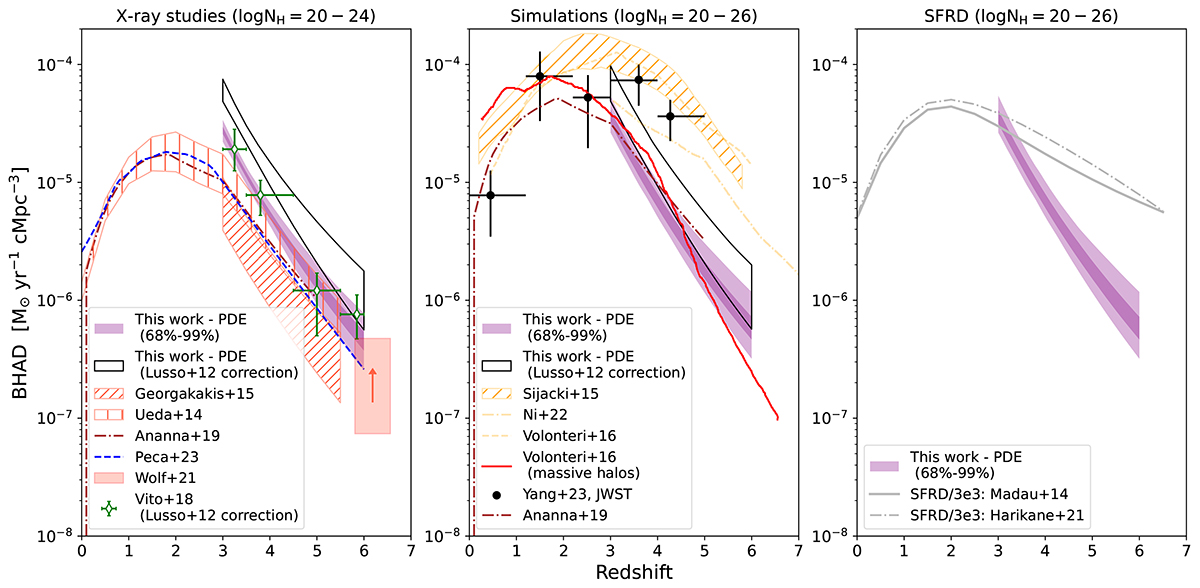
Download original image
Redshift evolution of the black hole accretion rate density. The shaded regions represent the 68% and 99% confidence intervals of the BHAD using the best-fitting PDE model. For comparison, shown are (from left to right) our results with previous X-ray studies (Georgakakis et al. 2015; Ueda et al. 2014; Vito et al. 2018; Wolf et al. 2021; Peca et al. 2023), with simulations (Volonteri et al. 2016; Ni et al. 2022; Sijacki et al. 2015), and with the star formation rate density scaled down by a factor of 3000 (Madau & Dickinson 2014; Harikane et al. 2022). The black regions in the first two panels indicate the 99% confidence interval of the BHAD adopting the bolometric correction by Lusso et al. (2012) for direct comparison to the results of Vito et al. (2018). The black points in the middle panel correspond to the JWST results by Yang et al. (2023). The brown dash-dotted line shows the predicted XLF derived by Ananna et al. (2019).
Current usage metrics show cumulative count of Article Views (full-text article views including HTML views, PDF and ePub downloads, according to the available data) and Abstracts Views on Vision4Press platform.
Data correspond to usage on the plateform after 2015. The current usage metrics is available 48-96 hours after online publication and is updated daily on week days.
Initial download of the metrics may take a while.