Fig. 14.
Download original image
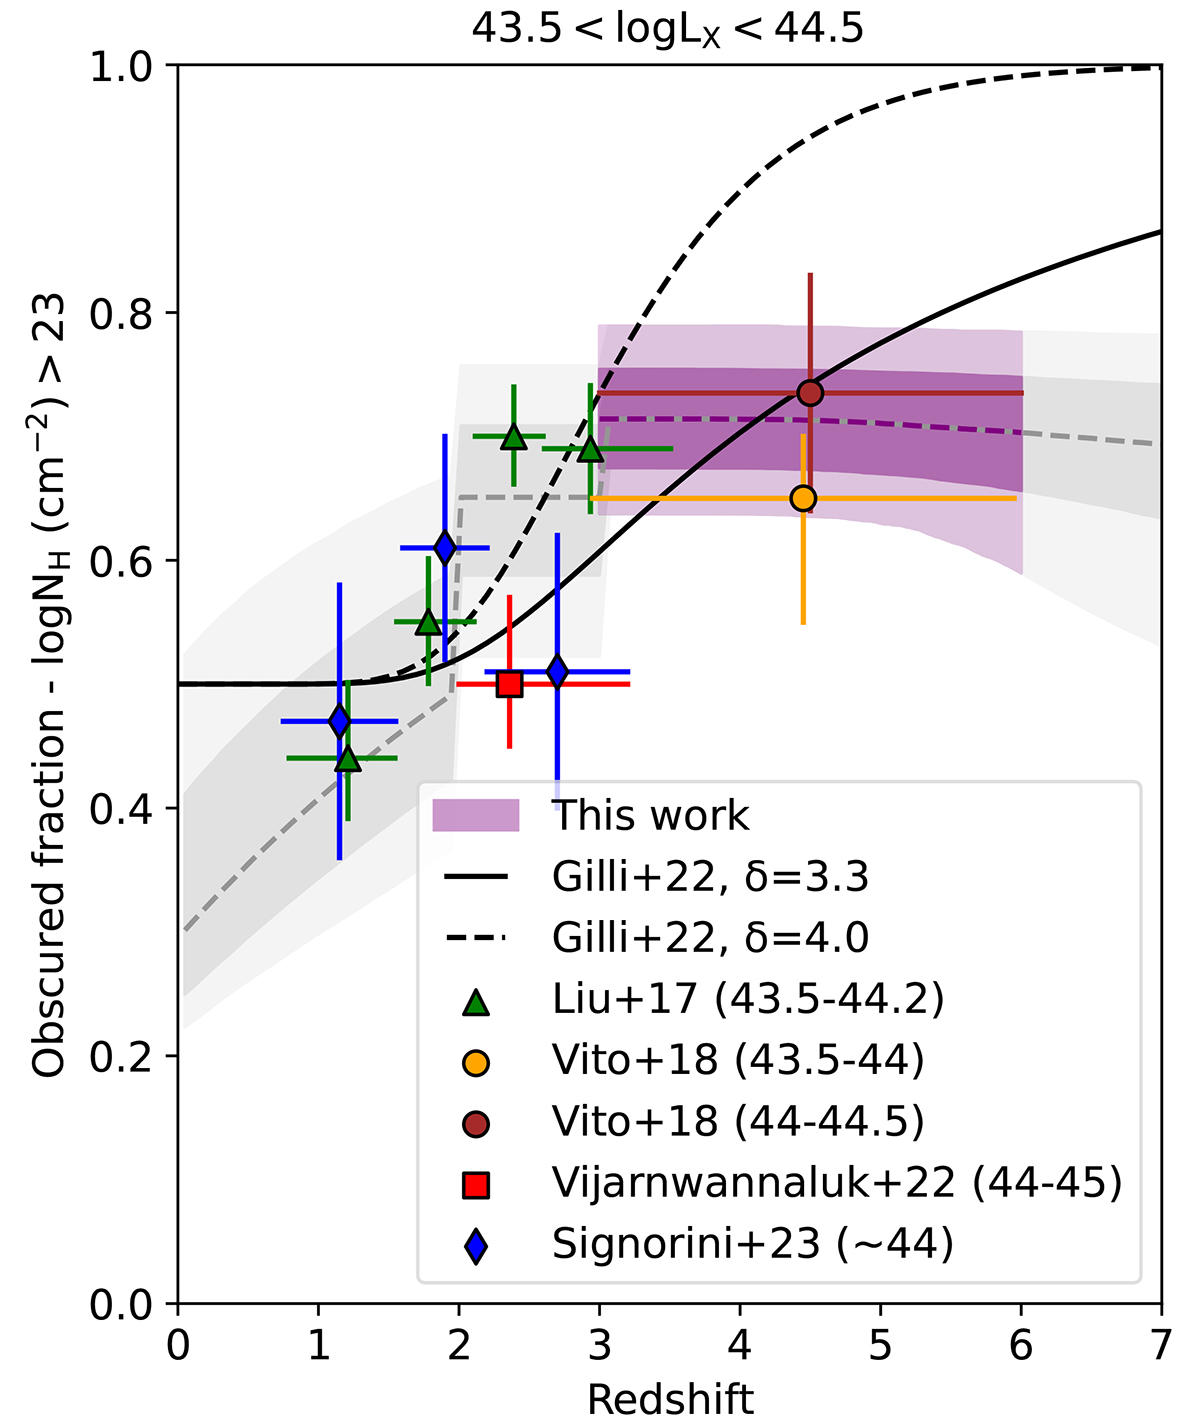
Obscured fraction with log NH ≥ 23 vs. redshift. Our results are shown as the purple shaded regions that represent the 68% and 95% confidence intervals of the best-fitting absorption function. Also shown are the extrapolation (grey shaded regions) of the absorption function below and above the redshift range of our analysis. For reference, shown are the results of Liu et al. (2017), Vito et al. (2018), Vijarnwannaluk et al. (2022), and Signorini et al. (2023), which span a wide range of redshifts. The luminosity ranges used in these studies are given in brackets (see legend in inset). The lines are the predictions of the obscuration fraction originated on both ISM and torus components (Gilli et al. 2022) for different values of the obscuration evolutionary factor, δ.
Current usage metrics show cumulative count of Article Views (full-text article views including HTML views, PDF and ePub downloads, according to the available data) and Abstracts Views on Vision4Press platform.
Data correspond to usage on the plateform after 2015. The current usage metrics is available 48-96 hours after online publication and is updated daily on week days.
Initial download of the metrics may take a while.