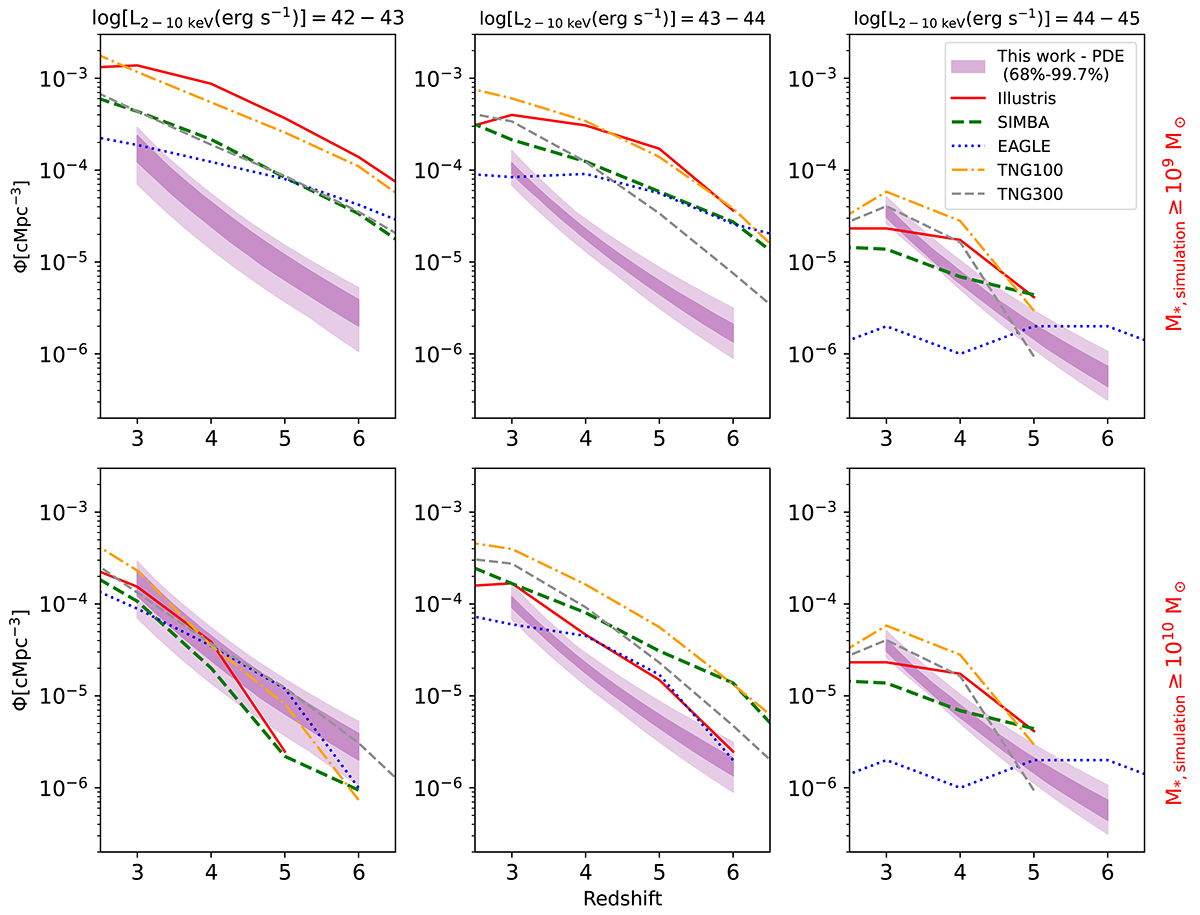
Fig. 12.
Download original image
Redshift evolution of the AGN space density in three luminosity bins, as indicated at the top of the panels. The shaded regions represent the 68% and 99.7% confidence intervals of the best-fitting LDDE model. The lines represent the space densities derived from different cosmological simulations (Habouzit et al. 2022). The upper and lower panels correspond to systems with stellar mass higher than M* > 109 M⊙ and M* > 1010 M⊙, respectively.
Current usage metrics show cumulative count of Article Views (full-text article views including HTML views, PDF and ePub downloads, according to the available data) and Abstracts Views on Vision4Press platform.
Data correspond to usage on the plateform after 2015. The current usage metrics is available 48-96 hours after online publication and is updated daily on week days.
Initial download of the metrics may take a while.