Fig. 11.
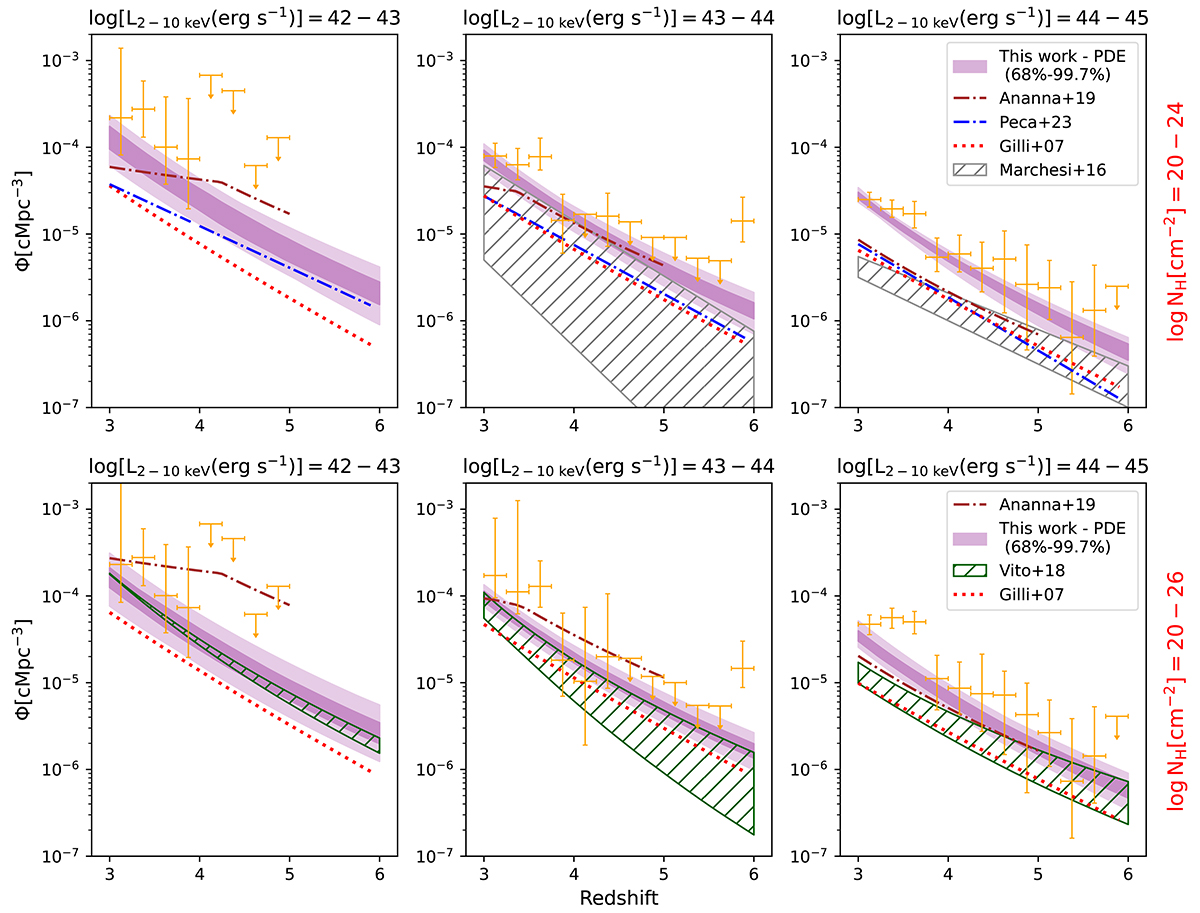
Download original image
Redshift evolution of the AGN space density in three luminosity for log NH = 20 − 24 (upper panels) and log NH = 20 − 26 (lower panels). The shaded regions represent the 68% and 99.7% confidence intervals of the best-fitting PDE model, while the points represent the binned luminosity function. For comparison, the results of Marchesi et al. (2016b), Vito et al. (2018), and Peca et al. (2023) are overplotted. The dotted red lines indicate the LDDE model predictions with an exponential decline (with a power-law decay) by Gilli et al. (2007). The brown dash-dotted lines show the predicted XLF derived by Ananna et al. (2019).
Current usage metrics show cumulative count of Article Views (full-text article views including HTML views, PDF and ePub downloads, according to the available data) and Abstracts Views on Vision4Press platform.
Data correspond to usage on the plateform after 2015. The current usage metrics is available 48-96 hours after online publication and is updated daily on week days.
Initial download of the metrics may take a while.